
Tag Technical Analysis

ETHUSDT Conflict Zone: Weekly Overbought vs. Intact Uptrend — Sept 30

AI generated symbolic artwork: colossal crystalline Ethereum diamond monument on a pedestal engraved 2683 amid overgrown ancient temple ruins, a red lightning arrow shattering into embers above it, the numeral 2737 carved on a distant archway, candlestick-shaped stone monuments under a storm sky

Ethereum holds the line above the 2,683 weekly moving average while the weekly Stochastic RSI pins at 100 — a classic overbought warning inside an intact uptrend. We lean hold between 2,683 and 2,710, cut size in the conflict zone, and let a successful retest of 2,640–2,683 confirm the next leg toward 2,749. #ETHUSDT #Ethereum #TechnicalAnalysis #CryptoTrading #MacroAnalysis #FederalReserve #CryptoMarkets #TradingView

BTCUSDT Conflict Zone: Intraday Weakness vs. Confirmed Uptrend — Sept 29

AI generated symbolic artwork: a colossal Bitcoin coin monument on a storm-lashed coastal clifftop holds the 84,000 shelf as a red sell-off arrow shatters into embers above it, the 85,241 target carved into a sea stack above the open sea

Bitcoin sits just under the 84,000 shelf in a textbook conflict zone — intraday distribution pushing against a confirmed daily uptrend while Core PCE, ISM and payrolls loom. We stay defensive for the next 24 hours, expecting consolidation between 82,500 and 83,800, and would only turn conditional long on a clean, volume-backed reclaim of 84,000. #bitcoin #BTCUSDT #BTCUSDTTechnicalAnalysis #BTCUSDTPriceAnalysis #TechnicalAnalysis #CryptoTrading #MacroAnalysis #FederalReserve

SOLUSDT Pullback: Intact Uptrend vs Overbought Week — Sept 28

AI generated symbolic artwork: colossal Solana emblem monument holding the 115 support shelf as a red lightning arrow shatters before touching it, with the 125 ceiling carved into a distant cliff

Solana surged 22% and stalled right under the 125 ceiling — a healthy pause at a genuine decision point, not a top. Hold 114-115 with positive money flow and the dip toward 120-124 becomes a buy; lose it and 108 is the next real floor. The trend is our friend here, but the pullback deserves respect. #Solana #SolanaETF #SolanaPriceAnalysis #SOLUSDTMarketAnalysis #SOLUSDTPricePrediction #TechnicalAnalysis #CryptoTrading #MacroAnalysis

ETHUSDT Pullback: Distribution vs. Intact Uptrend — Sept 28

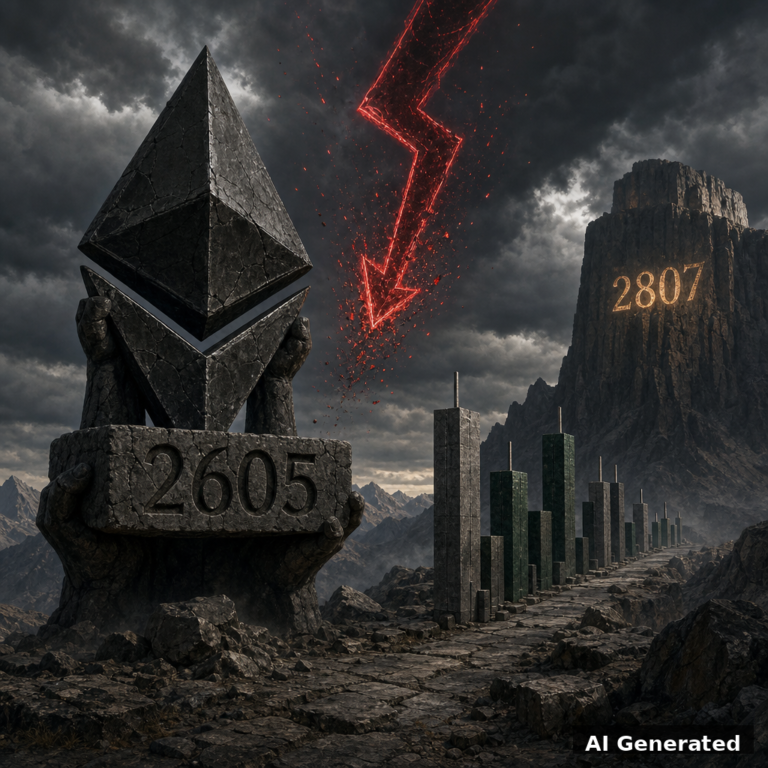
AI generated symbolic artwork: a colossal stone Ethereum diamond monument grips the 2605 support shelf while a red lightning arrow shatters into embers and the 2807 target glows on a distant cliff

Ethereum tagged $2,800 and got turned back — the intraday frames now flash distribution while the weekly and daily charts stay firmly bullish. We are not chasing the short into deeply oversold StochRSI, and we are not adding longs until ETH reclaims the weekly MA-90 at $2,682. The 2605-2606 floor and the 2682 line decide the next 48 hours. #Ethereum #ETHUSDT #cryptoanalysis #marketstructure #ChaikinMoneyFlow #trading #TechnicalAnalysis #Bybit

BTCUSDT Pullback: Distribution vs. Intact Uptrend — Sept 28

AI generated symbolic artwork: a colossal stone Bitcoin coin standing firm on a rock shelf carved 82,000 while a red lightning arrow shatters into embers, with 85,241 carved into a distant cliff

Bitcoin pulls back to 83,214 and the intraday money flow screams distribution — but the daily and weekly uptrend is still intact. This is a conflict zone, and the plan is patience: let the 82,000–82,500 shelf show its hand before any conditional long toward 85,241. #BTCUSDT #Bitcoin #IranConflict #technicalanalysis #trading #cryptomarket #BTC #MacroAnalysis

Cracked stone Bitcoin emblem glowing on cliff ruins

Bitcoin's structural support finally cracked this week. The cascade from $65,170 to $62,505 was textbook: first domino Monday, extreme oversold midweek, daily structure broken Thursday, new 1W low Saturday. Every encoded rule fired within its predicted window. The +3% relief bounce in the prior week turned out to be the last gasp before the bear cycle reasserted. All five lower timeframes showed distribution; weekly DMI confirmed maximum bear conviction. What happens when the 1W low at $62,505 fails next? The 60,800–61,000 zone awaits.

#Bitcoin #Crypto #BTC #Trading #CryptoAnalysis #BearMarket

BTC Bounces 2,710 Points Off the Weekly Low, but the Bounce Was the Trade 10.08.2026

Bitcoin bull statue charging on crumbling bridge, stormy sky. !AI generated

Bitcoin told two stories. On the surface: a 2,710-point bounce off the weekly low of $62,266.6 to $65,366.8 looked like recovery. Underneath: the 1W STRONG BEAR CONFIRMED per RL-13 held all week. Monday brought the 1D last domino FALL (1D Hist −174.6). Wednesday's 2H/4H K=100 Lesson 30 apex cluster broadened to 5 timeframes by Saturday. Sunday: 4H MACD bearish cross — the first cascade domino per Lesson 33. Scorecard: 3/3 direction, 0/3 price, 1/3 timing = 4/9. The bounce stalled 24 points below 65,000. The cascade is coming. #Bitcoin #BTC #BTCUSDT #CryptoTwitter #CryptoCommunity #Cryptocurrency #BitcoinNews #CryptoTrading #BitcoinTrading #TechnicalAnalysis #ChartAnalysis #BearTrend #BearMarket #ShortSetup #ApexCluster #Cascade #RiskManagement #MarketAnalysis #CryptoAnalysis #DeFi #Web3

The Week Bitcoin Tried to Climb and Got Pushed Back Down 19 – 25.07.2026

Candle flame reaching carved Bitcoin symbol above

This week, Bitcoin tried to climb above the $66,400 ceiling and got pushed back down. We opened at $63,919, saw buyers push the price to $66,131 by midweek, then watched it give back every point by Saturday's close at $64,237. The 1M MA1 hard ceiling held by less than $300 of margin. A 4-timeframe MACD bearish cross cascade completed between Wednesday and Friday, confirming the pre-week SHORT call was right on direction but wrong on bounce magnitude. The setup heading into next week is cautious — sellers clearly have control, with momentum fading fast. The 1D last domino is expected within 1-2 sessions, with bear case continuation to $62,500-$63,000 if the $63,750 floor breaks. #BTC #Bitcoin #CryptoAnalysis #BearishTrend #TradingSignals #CryptoMarket

Bitcoin: The Week The Dead-Cat Bounce Failed — 4-TF MACD Cascade Reasserts The Bear Cycle

Giant Bitcoin coin amid storm and falling charts

This week's BTC retrospective delivers a brutal lesson: a pre-week SHORT call predicted a 45% bear scenario targeting 60,000, but reality delivered something far more violent. A 1,313-point cascade broke all support, then exploded into a 1,631-point dead-cat bounce — only to collapse another 1,295 points in 24 hours. The 4-timeframe MACD bearish cross cascade has now fully reasserted itself. Saturday closed at 63,919 with the weekly bear trend INTACT. The critical question: will Monday's reaction bounce fade at the 63K resistance, or will it signal that the macro bear cycle has finally exhausted itself at 62,464?
#Bitcoin #Crypto #BTC #Trading #CryptoTrading #TechnicalAnalysis