





-

Bitcoin’s structural support finally cracked this week. The cascade from $65,170 to $62,505 was textbook: first domino Monday, extreme oversold midweek, daily structure broken Thursday, new 1W low Saturday. Every encoded rule fired within its predicted window. The +3% relief bounce in the prior week turned out to be the…
-

(BTC) Weekly Fundamental Analysis – August 10, 2026
Bitcoin sits at $64,059, trapped between whale accumulation and fleeing retail investors. Volume has collapsed to critical lows. Stagflation, Hormuz disruption, and US debt growth are squeezing markets globally. Our 4-week forecast targets $58,925 by August 31, with 45% bear probability. Whales are removing supply like central banks defending a…
-

BTC Bounces 2,710 Points Off the Weekly Low, but the Bounce Was the Trade 10.08.2026
Bitcoin told two stories. On the surface: a 2,710-point bounce off the weekly low of $62,266.6 to $65,366.8 looked like recovery. Underneath: the 1W STRONG BEAR CONFIRMED per RL-13 held all week. Monday brought the 1D last domino FALL (1D Hist −174.6). Wednesday’s 2H/4H K=100 Lesson 30 apex cluster broadened…
-

The Week Bitcoin Tried to Climb and Got Pushed Back Down 19 – 25.07.2026
This week, Bitcoin tried to climb above the $66,400 ceiling and got pushed back down. We opened at $63,919, saw buyers push the price to $66,131 by midweek, then watched it give back every point by Saturday’s close at $64,237. The 1M MA1 hard ceiling held by less than $300…
-

Bitcoin: The Week The Dead-Cat Bounce Failed — 4-TF MACD Cascade Reasserts The Bear Cycle
This week’s BTC retrospective delivers a brutal lesson: a pre-week SHORT call predicted a 45% bear scenario targeting 60,000, but reality delivered something far more violent. A 1,313-point cascade broke all support, then exploded into a 1,631-point dead-cat bounce — only to collapse another 1,295 points in 24 hours. The…
-

Bitcoin: The Week The Bounce Won — And The 2H MACD Bearish Cross That Ended It
Bitcoin sits at $61,744 after testing a weekly low of $57,755. The bounce has reached extreme overbought levels (4H Stoch RSI at 96, 6H at 98, 12H at 100), but the 12H MA1 at 63,000 acts as a hard ceiling. The monthly chart reveals the truth: bear cycle has just…
-
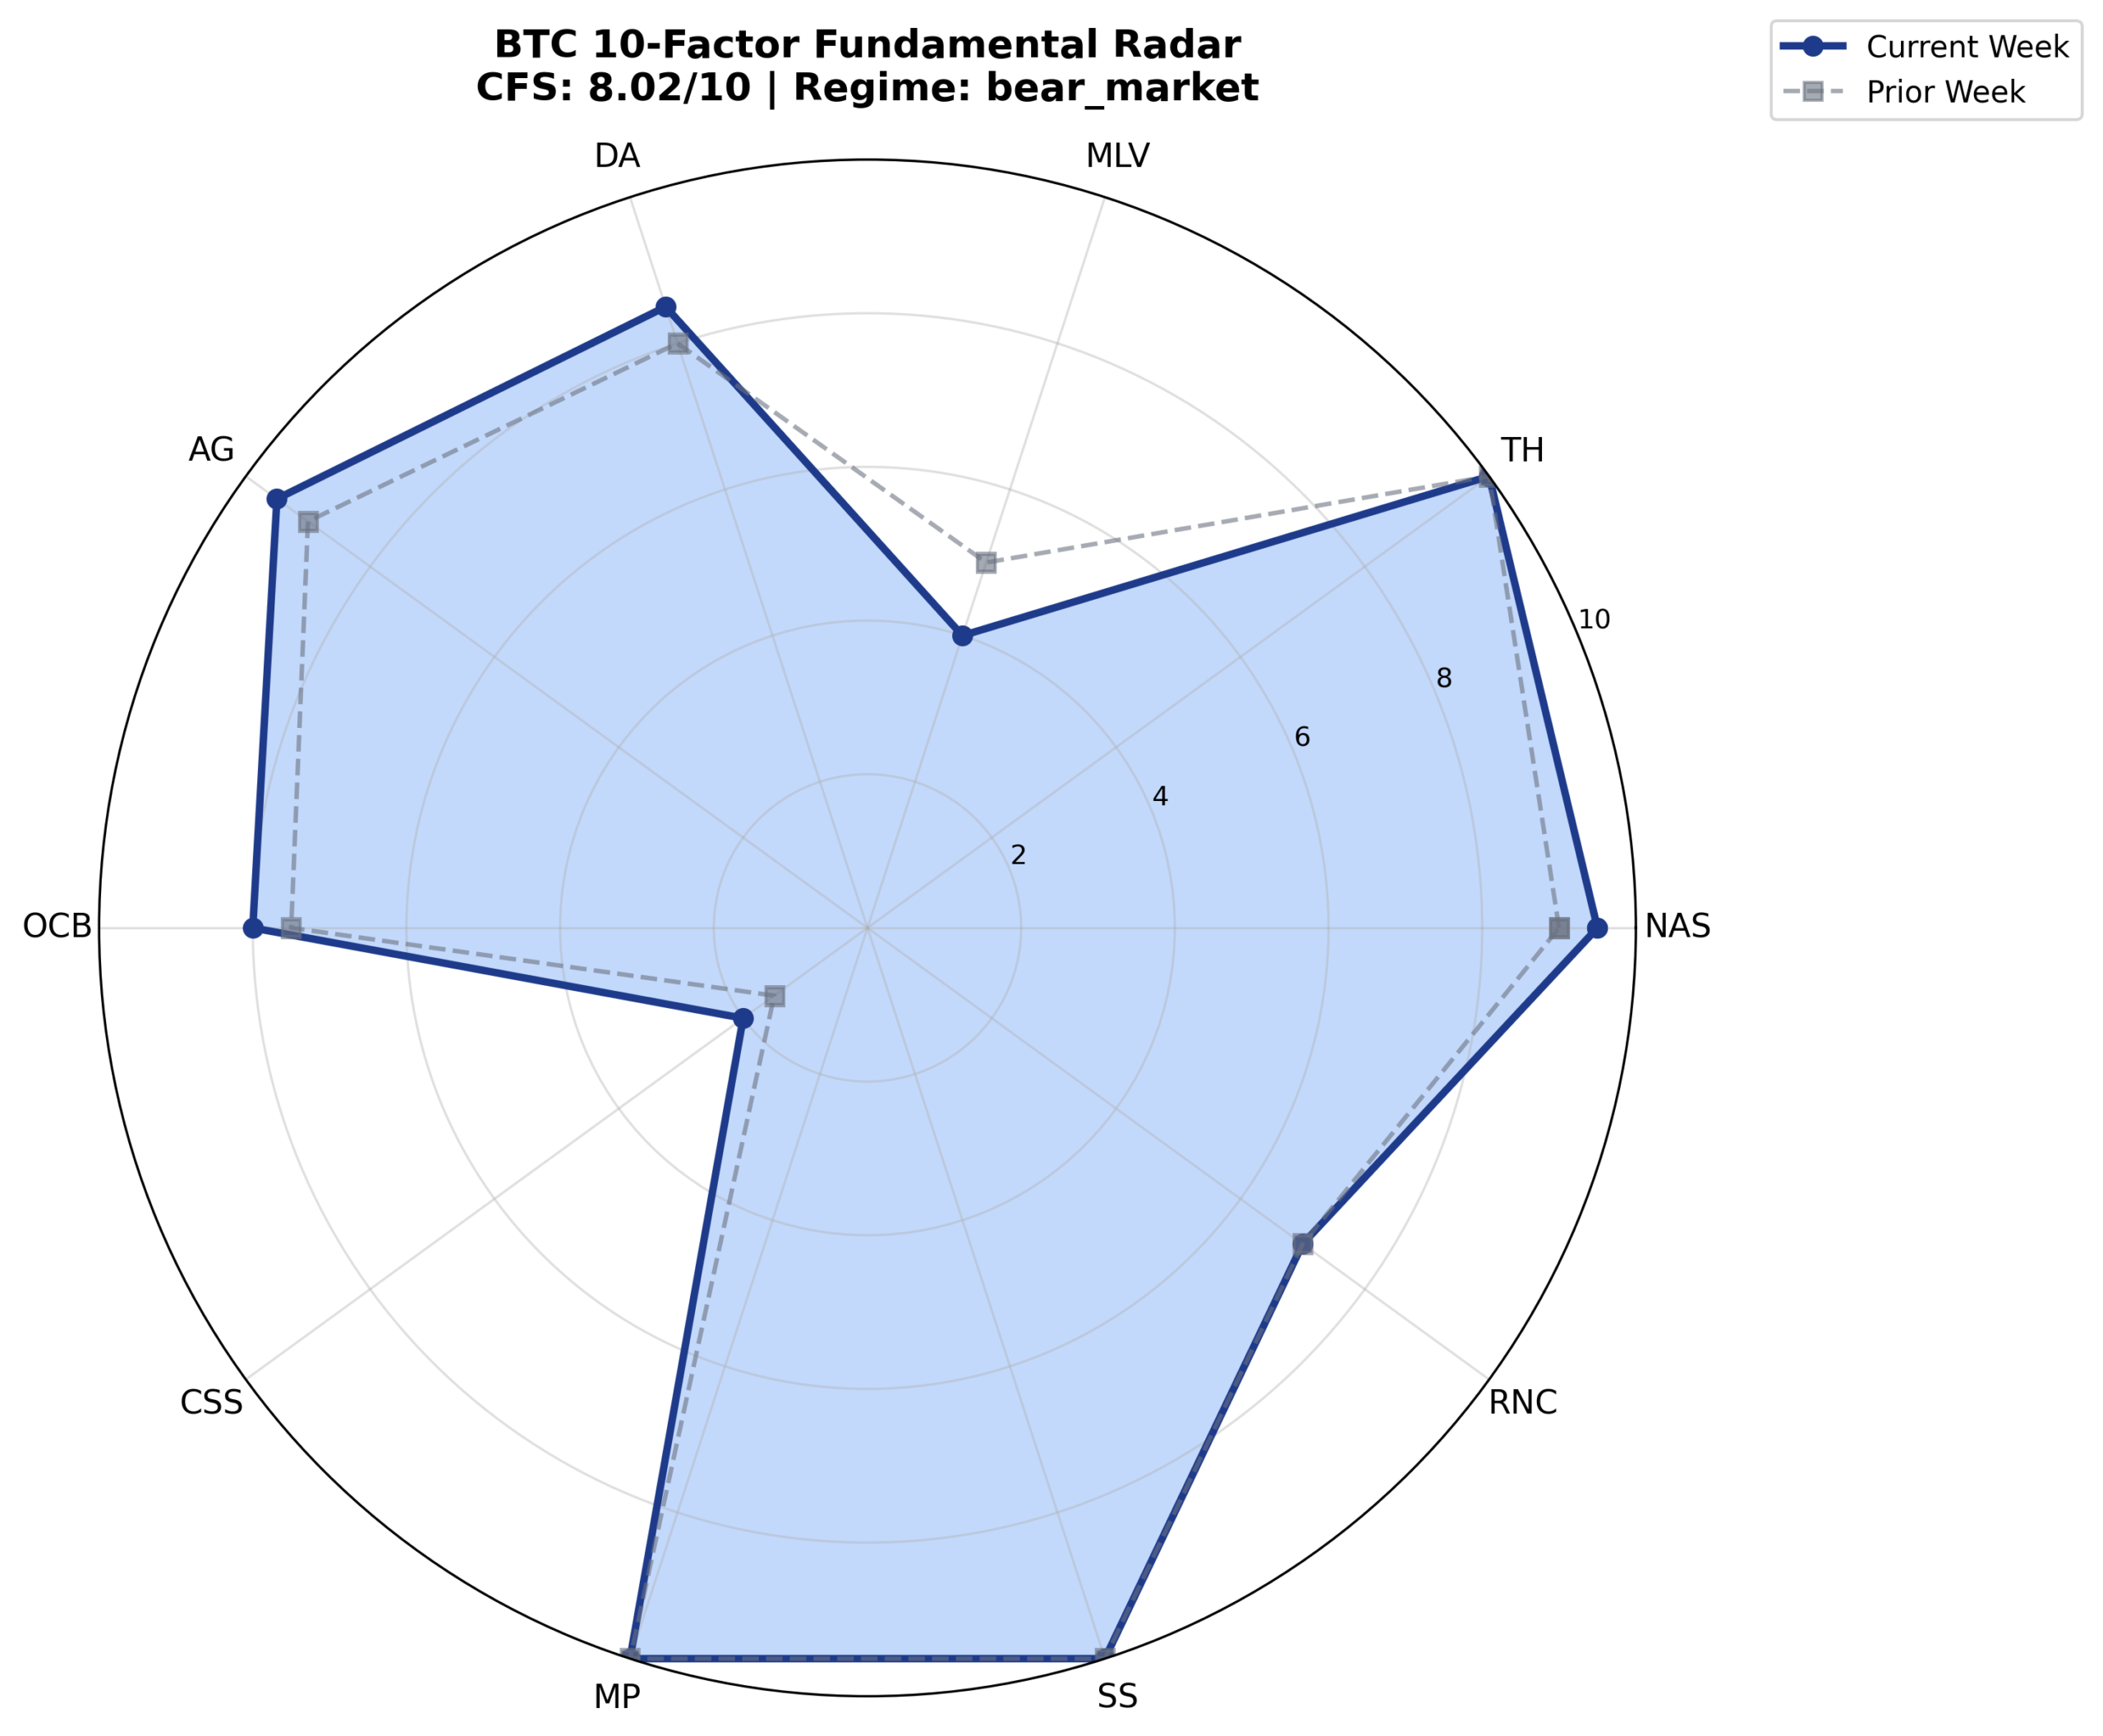
Bitcoin (BTC) Monthly Fundamental Analysis – July 03, 2026
Bitcoin trades at $61,672 with extreme fear (F&G: 21) and strong fundamentals (CFS: 8.02/10). Our enhanced 4-week forecast targets $63,062 (Week 1, 45% confidence) to $66,109 (Week 4, 25% confidence), revealing a critical fundamentals-vs-sentiment divergence. Short-term technical signals suggest accumulation while long-term fundamental value discovery supports sustained recovery. Will technical…
-

Bitcoin: Bounce Exhausts at 62K, Macro Bear Cycle Just Beginning.
Bitcoin sits at $61,744 after testing a weekly low of $57,755. The bounce has reached extreme overbought levels (4H Stoch RSI at 96, 6H at 98, 12H at 100), but the 12H MA1 at 63,000 acts as a hard ceiling. The monthly chart reveals the truth: bear cycle has just…
-

Bitcoin Bounce Meets the Wall at 61,200 — Weekly Maximum Bearish Conviction Holds the Line – 2026 07 01
Bitcoin (BTCUSDT.P) trades at $60,141.7 on July 1, 2026, after a relief bounce from the weekly low of $57,755.8 reached the 4H MA1 resistance zone at $60,236. The 2H Stoch RSI shows extreme overbought conditions at K=100/89.34, signaling imminent exhaustion. Daily ADX at 38.11 with -DI dominance confirms the strong…
-

Bitcoin’s Bear Market Continuation — The Bounce Has Failed, Lower Prices Loom – 2026 06 29
BTC trades $59,795 on June 29, capping an 8-week collapse from May’s $80,086 highs — a brutal -25.7% decline. Yesterday’s green candle was completely erased today, the textbook dead cat bounce failure. Weekly MACD sits at -6,209 with -DI dominating +DI by 2.37x. Daily Stochastic RSI at K=8.16 and weekly…
-

Bitcoin Slides Below 62K as Macro Bear Regime Tightens Its Grip – 2026 06 25
Our prior prediction of continued bearish pressure has been validated. The market did not produce a daily close above 63,500 (our prior resistance flip), confirming sellers remain in control. Looking forward, the critical battleground is the $60,650 level — this is the immediate floor. A break and weekly close below this would expose…
-

Bitcoin’s Reaction Bounce Approaches Overbought Ceiling Within Dominant Bear Structure – 2026 06 17
Bitcoin (BTC) trades at 65,591 – 65,640 across all monitored timeframes as of June 17th, 2026, marking a continuation of the reaction bounce from the 60,614 weekly low set on June 8th. The price has gained approximately 8.3% from that weekly low, but today’s technicals reveal that this bounce is…