

Category Crypto Token Analysis

The Week Bitcoin Tried to Climb and Got Pushed Back Down 19 – 25.07.2026

Candle flame reaching carved Bitcoin symbol above

This week, Bitcoin tried to climb above the $66,400 ceiling and got pushed back down. We opened at $63,919, saw buyers push the price to $66,131 by midweek, then watched it give back every point by Saturday's close at $64,237. The 1M MA1 hard ceiling held by less than $300 of margin. A 4-timeframe MACD bearish cross cascade completed between Wednesday and Friday, confirming the pre-week SHORT call was right on direction but wrong on bounce magnitude. The setup heading into next week is cautious — sellers clearly have control, with momentum fading fast. The 1D last domino is expected within 1-2 sessions, with bear case continuation to $62,500-$63,000 if the $63,750 floor breaks. #BTC #Bitcoin #CryptoAnalysis #BearishTrend #TradingSignals #CryptoMarket

Bitcoin: The Week The Dead-Cat Bounce Failed — 4-TF MACD Cascade Reasserts The Bear Cycle

Giant Bitcoin coin amid storm and falling charts

This week's BTC retrospective delivers a brutal lesson: a pre-week SHORT call predicted a 45% bear scenario targeting 60,000, but reality delivered something far more violent. A 1,313-point cascade broke all support, then exploded into a 1,631-point dead-cat bounce — only to collapse another 1,295 points in 24 hours. The 4-timeframe MACD bearish cross cascade has now fully reasserted itself. Saturday closed at 63,919 with the weekly bear trend INTACT. The critical question: will Monday's reaction bounce fade at the 63K resistance, or will it signal that the macro bear cycle has finally exhausted itself at 62,464?
#Bitcoin #Crypto #BTC #Trading #CryptoTrading #TechnicalAnalysis

Bitcoin: The Week The Bounce Won — And The 2H MACD Bearish Cross That Ended It

Bitcoin symbol on cliff with scales and storm

Bitcoin sits at $61,744 after testing a weekly low of $57,755. The bounce has reached extreme overbought levels (4H Stoch RSI at 96, 6H at 98, 12H at 100), but the 12H MA1 at 63,000 acts as a hard ceiling. The monthly chart reveals the truth: bear cycle has just begun, not ended. With monthly RSI at 42 but its MA still at 55, price cannot sustainably break above 60K until that MA bounces back to high 50's. Will BTC hover at 55K as the monthly bear cycle extends, or will 50K become the next target? #Bitcoin #CryptoAnalysis #BTC #TechnicalAnalysis #CryptoTrading #BearMarket

Bitcoin (BTC) Monthly Fundamental Analysis – July 03, 2026

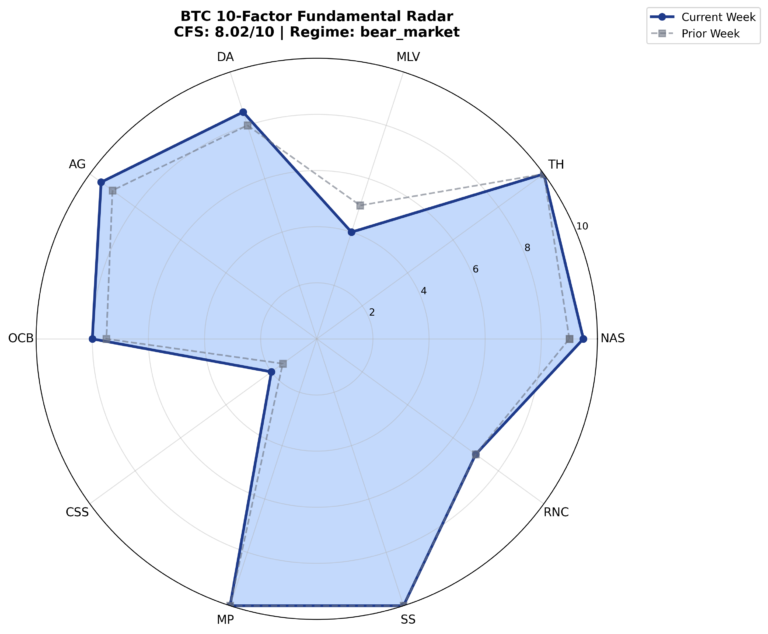
BTC 10-factor radar chart, bear market regime

Bitcoin trades at $61,672 with extreme fear (F&G: 21) and strong fundamentals (CFS: 8.02/10). Our enhanced 4-week forecast targets $63,062 (Week 1, 45% confidence) to $66,109 (Week 4, 25% confidence), revealing a critical fundamentals-vs-sentiment divergence. Short-term technical signals suggest accumulation while long-term fundamental value discovery supports sustained recovery. Will technical confirmation override bearish market sentiment and drive the recovery thesis forward? #Bitcoin #BTC #CryptoAnalysis #FundamentalAnalysis #CryptoTrading #MarketOutlook

Bitcoin: Bounce Exhausts at 62K, Macro Bear Cycle Just Beginning.

Climber ascending mountain towards Bitcoin flag at summit

Bitcoin sits at $61,744 after testing a weekly low of $57,755. The bounce has reached extreme overbought levels (4H Stoch RSI at 96, 6H at 98, 12H at 100), but the 12H MA1 at 63,000 acts as a hard ceiling. The monthly chart reveals the truth: bear cycle has just begun, not ended. With monthly RSI at 42 but its MA still at 55, price cannot sustainably break above 60K until that MA bounces back to high 50's. Will BTC hover at 55K as the monthly bear cycle extends, or will 50K become the next target? #Bitcoin #CryptoAnalysis #BTC #TechnicalAnalysis #CryptoTrading #BearMarket

Bitcoin Bounce Meets the Wall at 61,200 — Weekly Maximum Bearish Conviction Holds the Line – 2026 07 01

Bitcoin symbol figure amid crashing market arrows

Bitcoin (BTCUSDT.P) trades at $60,141.7 on July 1, 2026, after a relief bounce from the weekly low of $57,755.8 reached the 4H MA1 resistance zone at $60,236. The 2H Stoch RSI shows extreme overbought conditions at K=100/89.34, signaling imminent exhaustion. Daily ADX at 38.11 with -DI dominance confirms the strong bear trend, while weekly indicators reflect maximum bearish conviction (RL-13). Strategy: short bounces into the $60,200-$60,900 zone, stops above $61,700, targets $58,500, the weekly low at $57,755, and ultimately the $54,000-$56,000 macro zone if support breaks. All bounces remain counter-trend reactions.

#BTCUSDT #BitcoinAnalysis #BearishTrend #TradingSignals #BTCForecast #CryptoMarket

Bitcoin’s Bear Market Continuation — The Bounce Has Failed, Lower Prices Loom – 2026 06 29

Cracked Bitcoin coin on cliff during storm

BTC trades $59,795 on June 29, capping an 8-week collapse from May's $80,086 highs — a brutal -25.7% decline. Yesterday's green candle was completely erased today, the textbook dead cat bounce failure. Weekly MACD sits at -6,209 with -DI dominating +DI by 2.37x. Daily Stochastic RSI at K=8.16 and weekly at K=8.65 scream oversold — yet weekly CMF at -0.09 remains in distribution. In our knowledge stack, this combination historically signals continuation, not reversal. Smart money is selling every bounce. Base case sees $59,000 test; bear case envisions $54,000-55,000. Will the weekly low at $58,850 hold, or trigger another cascade?
#Bitcoin #CryptoAnalysis #BearMarket #BTCTrading #ShortSetup #CryptoMarkets

Bitcoin Slides Below 62K as Macro Bear Regime Tightens Its Grip – 2026 06 25

Climber overlooking snowy mountains and skull-shaped rock

Our prior prediction of continued bearish pressure has been validated. The market did not produce a daily close above 63,500 (our prior resistance flip), confirming sellers remain in control. Looking forward, the critical battleground is the $60,650 level — this is the immediate floor. A break and weekly close below this would expose the Weekly Low of $59,065 and potentially a flush to the $58,000-58,500 zone. Conversely, any sustained push above $62,476 (2H MA #1) would challenge the bear narrative, with $63,500 (4H MA #1) as the next major test.#BTC #CryptoAnalysis #BearishTrend #Bitcoin #TradingSignals #CryptoMarket

Bitcoin’s Reaction Bounce Approaches Overbought Ceiling Within Dominant Bear Structure – 2026 06 17

Golden Bitcoin bull chained on cliff edge

Bitcoin (BTC) trades at 65,591 – 65,640 across all monitored timeframes as of June 17th, 2026, marking a continuation of the reaction bounce from the 60,614 weekly low set on June 8th. The price has gained approximately 8.3% from that weekly low, but today's technicals reveal that this bounce is approaching a critical inflection point where the dominant weekly bearish structure is likely to reassert itself. #Bitcoin #BTCUSDT #CryptoAnalysis #BearishTrend #TradingSignals #ReliefBounce #BTC

Bitcoin Relief Bounce Meets Overwhelming Resistance as Bear Cycle Deepens – 2026 06 11

Cracked Bitcoin symbol with crown in desert landscape

Bitcoin is attempting a short-term recovery at $62,733 as of June 11th, but the technical picture reveals this bounce is fighting an uphill battle against a deeply entrenched bearish structure. Comparing today's action to our June 9th analysis, price has stabilized in the $62,700 zone after briefly testing $61,476 on the daily, but the underlying momentum indicators tell a sobering story about the sustainability of this recovery. #Bitcoin #BTCUSDT #CryptoAnalysis #BearishTrend #TradingSignals #ReliefBounce #BTC