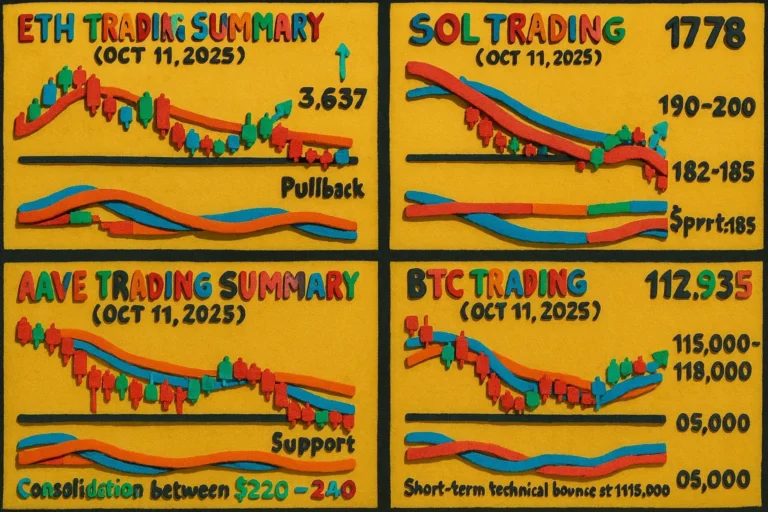
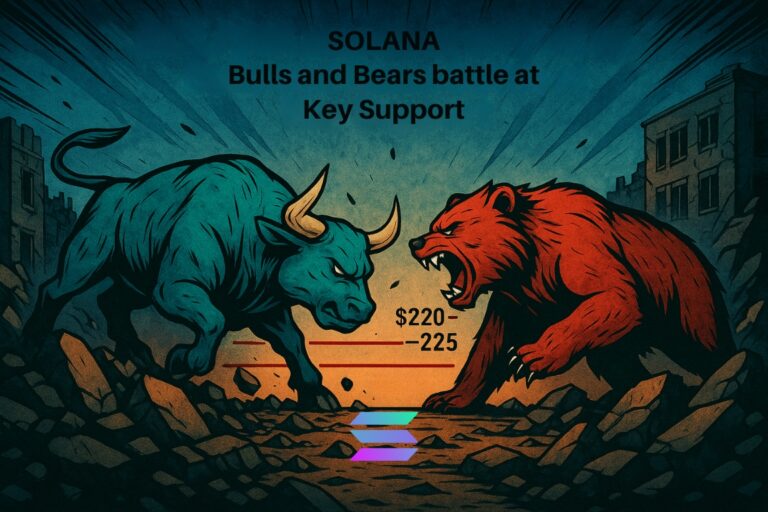
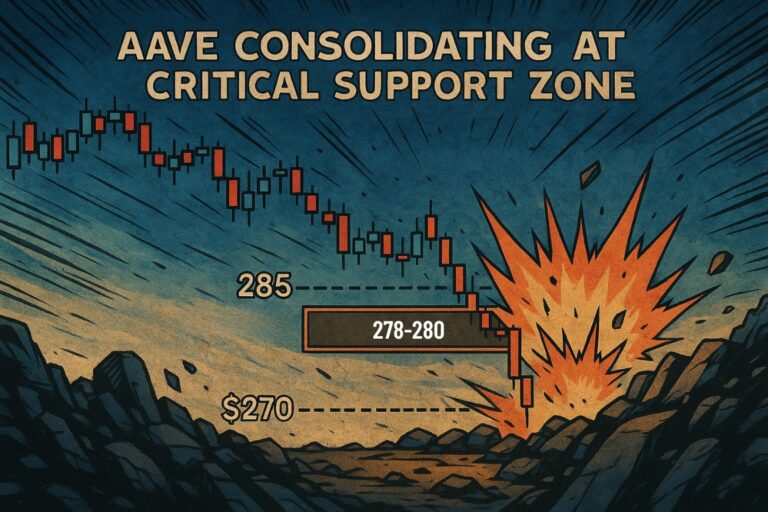
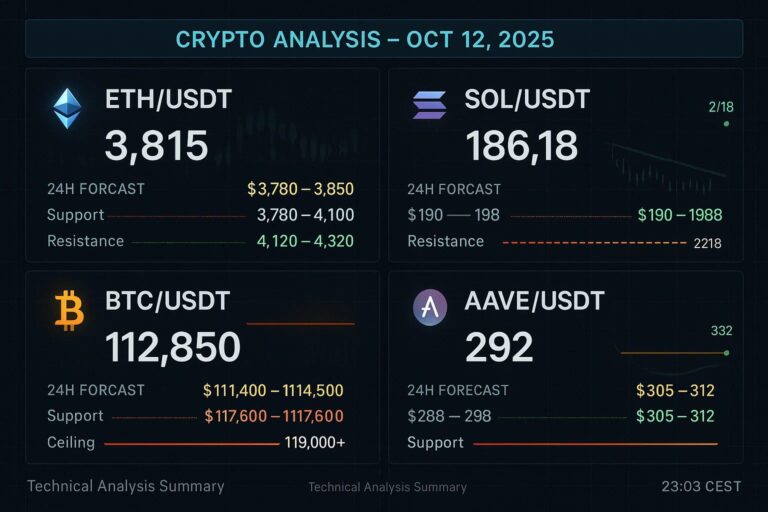
Category Crypto Token Analysis

Solana Stands at Critical Crossroads as Bulls and Bears Battle at Key Support.  

Technical indicator signal strength chart for Solana showing MACD, RSI, DMI, SRSI, and CMF scores across six timeframes from 2H to 1W, with values ranging from negative one to positive one indicating bearish to bullish sentiment

Looking ahead, the next twenty-four to forty-eight hours will determine Solana's trajectory through year-end. If bulls can hold the $218-220 support zone and push above $228 resistance, a renewed uptrend targeting $235-240 becomes probable. However, a decisive break below $218 would likely trigger a retest of $210-212 support levels. For now, the battle continues, with both scenarios remaining viable depending on which force wins the war at this critical juncture.

Ethereum Market Insight: The Bear Trap Narrative

Ethereum bear trap analysis chart showing indicator signal scores across six timeframes with short-term bearish readings transitioning to bullish weekly structure on October 9, 202

This divergence between short-term bearishness and medium-to-long-term bullishness created the textbook conditions for a bear trap, where aggressive sellers push price down only to face a swift reversal as stronger hands accumulate at discount levels. Our analysis yesterday correctly anticipated sideways consolidation as price would catch up to faster moving averages before resuming its uptrend, and today's action validates that thesis perfectly.

Bitcoin’s Calculated Correction Points to Bullish Revival.

BTC indicator signal scores chart showing MACD, RSI, DMI, SRSI, and CMF across six timeframes (2H, 4H, 6H, 12H, 1D, 1W) with values ranging from -1 (strong bearish) to +1 (strong bullish). Chart displays grouped bars color-coded by indicator revealing short-term bearish signals transitioning to longer-term bullish momentum.

Looking ahead, Bitcoin appears positioned for renewed upward momentum once current oversold conditions resolve. Support holds firm between $120,000-$121,500, with resistance targets at $124,000-$125,000 coming into focus. The convergence of oversold shorter timeframes and bullish longer timeframes creates an attractive risk-reward setup favoring longs

AAVE Consolidating at Critical Support Zone

AAVE price chart showing consolidation at critical support zone near 270 USDT with multiple DEMA moving averages converging

Our forecast centers on the 270-295 range as the battleground for the next 48 hours, with a bias toward downside continuation unless we see decisive reclamation of 285 with strong volume. Traders should watch for potential short-term bounces from extreme oversold conditions but maintain awareness that the structural bearish setup remains valid until price reclaims and holds above 300, the level we've consistently identified as the bullish invalidation point.

Ethereum Decisively Breaks Out—Multi-Timeframe Bullish Signals Point to New Highs ( 06.10.2025) 

Ethereum trading floor scene with holographic ETH logo transitioning from green bullish to red bearish lighting, symbolizing market exhaustion

Stochastic RSI on shorter timeframes is solidly overbought, indicating current demand remains robust, while higher timeframes trend neutral, which could buffer against immediate exhaustion. DMI across all intervals is bullish, with ADX strengthening, and positive money flow (CMF) confirming risk appetite. The only moderate caution is a leveling off in SRSI and CMF on daily and weekly windows, which suggests consolidation or short-term pauses could surface, but are not yet significant reversals.

AAVE Market Analysis Post (06.10.2025)

AAVE cryptocurrency trading scene showing price testing 300 USDT resistance level with glowing indicators and diverging volume signals in atmospheric trading floor setting

The weekly timeframe shows MACD histogram turning negative while CMF dips below zero for the first time during this rally phase, indicating higher timeframe participants are fading the move. A rejection at 305 could trigger rapid unwinding back toward 285 support, while a clean break above 310 with volume confirmation might extend toward 320. Current conditions favor defensive positioning with tight stops rather than aggressive long entries.