
Category Crypto Token Analysis

ETH Bearish Compression: Why the $3,040 Ceiling Defines the Next Major Move – 2025 12 24

A glowing cybernetic dragon made of circuitry coils around a dark floating mountain, guarding a neon Ethereum symbol at a $3,040 barrier while bears and price levels loom in a stormy sky.

What a difference forty-eight hours makes in the crypto markets. Just two days ago, we were tracking a hopeful relief rally that briefly pushed Ethereum above the psychological 3,000 level, but today we find ourselves back in the trenches of a bearish compression structure. Comparing today’s price action to our previous analysis, the market has strictly respected the "Trap Zone" we identified. The rejection at 3,060 on Monday wasn't just a random fluctuation; it was a structural failure that has now trapped late longs and forced price back into a tightly wound range around 2,925. The relief rally has effectively been erased, and the short-term trend has realigned with the dominant daily and weekly downtrends.

Bitcoin (BTCUSDT) Fundamental Analysis – 2025 12 23

Cinematic illustration of a glowing Bitcoin lighthouse rising from stormy ocean waves made of red and green candlestick charts, guiding institutional cargo ships past a dark whirlpool labeled “Extreme Fear” toward a distant 100K arch in the sky.

Traditional banking regulators issued guidance permitting banks to offer crypto custody services at scale, with the Wolfsberg Group (representing 12 major global banks including JPMorgan, HSBC, and Deutsche Bank) publishing principles for banking stablecoin issuers. This institutional green-lighting removes legacy barriers that previously restricted bank participation in crypto markets.

Bitcoin Bounces into Short Zone as Macro Bear Cycle Tightens 2025 12 22

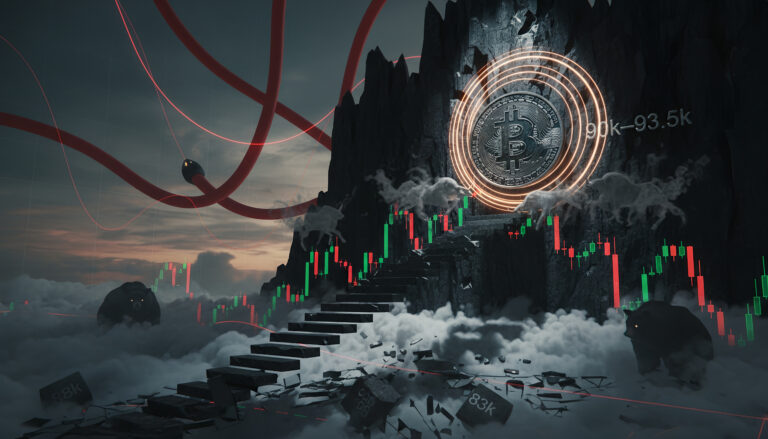
A dark, surreal crypto landscape shows a stone staircase of candlesticks rising through clouds toward a rocky cliff, where a glowing Bitcoin coin and “90k–93.5k” resistance level loom above collapsing “88k” and “83k” supports, with ghostly bulls and lurking bears.

The path ahead hinges on a handful of key levels. If 93-93.5k acts as true resistance and buyers exhaust here, the immediate support 88-88.5k becomes the battleground, with a break below opening the door to the 83k zone (weekly MA4 and a critical long-term support). Conversely, a sustained break above 94k with volume would force a reassessment and shift risk/reward against shorts. For now, the setup remains aligned with earlier calls: short bias, fade strength into the 90.5-93.5k band, and respect the larger bearish structure until proved otherwise.

Ethereum at the Cliff Edge: Bearish Breakdown vs Oversold Reversal Near $2,800–$3,000 / 2025 12 18

Cinematic digital illustration of a stormy ocean at night where a tall icy cliff made of red and green candlestick charts looms above crashing waves, red bear figures hammer the top near the 3000 level, a glowing blue Ethereum logo floats on a rocky 2800 platform above a whirlpool labeled 2700–2750, and golden arcs of compressed energy curve over the scene, symbolizing Ethereum’s struggle between bearish breakdown and potential bounce at key price levels.

Ethereum sits at a defining crossroads on December 18, trading at 2,837 after a brutal three-day cascade that saw price plummet nearly 10 percent from the 3,150 levels observed just 72 hours ago. The breakdown from the critical 3,200-3,300 consolidation zone we identified on December 15 as the make-or-break level has materialized with devastating speed, confirming that the failed support has now transformed into formidable resistance.

Bitcoin’s Bounce Inside A Bigger Downtrend 2025 12 15

A cinematic digital illustration of a stormy ocean with huge waves crashing against jagged rocks, a glowing Bitcoin symbol floating on a small wooden platform in the water, and a steep cliff made of red and green candlesticks with a broken staircase, overlaid by MACD, RSI and Stoch RSI gauges in the cloudy sky.

For traders, this is still a market to fade strength rather than chase it. Rallies into 90k–91.5k are candidates for carefully managed shorts, while dip‑buys near 88k are strictly tactical and should be treated as scalps inside a larger bearish structure. Until daily RSI can reclaim 50 and price can climb back above the 12‑hour MA1, Bitcoin’s recent bounce looks like a pause in the downtrend, not the start of something bigger.

Solana’s Trap: Bullish Intraday Signals Clash with Macro Bearish Reality 2025 12 12

Neon Solana logo hovers above a broken stone bridge of price levels labeled 135, 140, 142, and 150 inside a stadium, where glowing green bulls charge from the 135 side toward a bright 142 stone as red‑armored bear knights defend a fiery 140–150 gate under stormy skies.

 The market is currently trapping both sides. Bulls are betting on the intraday momentum and the reclaim of short-term MAs, while bears are defending the macro resistance at 140-150. We favor a Consolidation scenario (50% probability) where SOL struggles to break 140 cleanly and eventually rotates lower. A rejection here targets a return to the 135.00 support floor. Traders should watch the 142.00 level closely—only a sustained close above this invalidate the immediate bearish thesis and opens the door for a test of 150. Until then, treat rallies as selling opportunities.

Overbought Climb Inside an Unproven Weekly Reversal 2025 12 10

A glowing Ethereum logo floats above a fragile glass staircase of price levels rising from 3100 through 3350 toward distant fiery mountains marked 3480–3520, while swirling EMA‑like ribbons, storm clouds, lightning, and MACD/RSI/DMI charts in the sky symbolize a tense yet hopeful crypto rally.

For the next 24–48 hours, our analysis favors consolidation or a controlled pullback toward 3,280–3,310 as a healthier way to extend this move. We treat that zone as the primary opportunity for renewed longs, with upside focus on 3,420 initially and then the 3,480–3,520 cluster where 12H and daily moving averages converge. Until weekly MACD and RSI clearly break their bearish shackles, we avoid assuming a full macro reversal and instead trade this as a strong but potentially fragile rally inside a still‑heavy higher‑timeframe trend.