
Category Crypto Token Analysis

AAVE Analysis: Navigating the Bearish Storm with Caution

Colossal ethereal AAVE ghost spirit rising from fortress on trading chart battlefield, wrapped in glowing chains, as bear and bull armies clash below at the critical $250 decision level

Looking ahead to the next 24 to 48 hours, we're watching $250 like hawks. A break below this level opens the door to $235 or even $228. But if AAVE holds $250 and we see the 2-hour and 4-hour RSI indicators start climbing, expect a violent reversal toward $260 and potentially $270. The compressed springs release with force.

Solana Finds Critical Support: Will $200 Mark the Reversal? (20251013PM).  

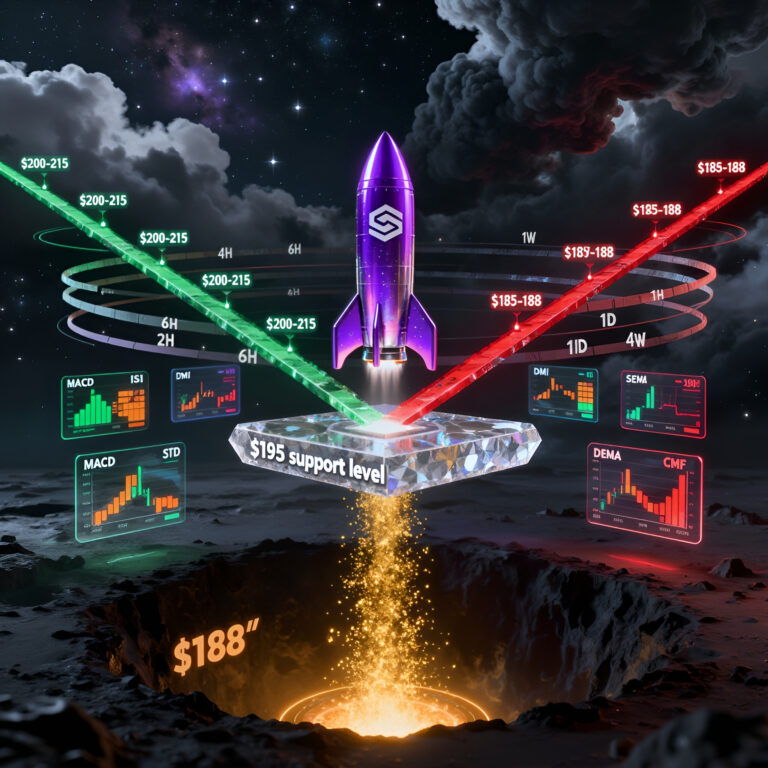
Solana cryptocurrency rocket ship at critical decision point suspended above $195 support level with ascending green path to $200-215 and descending red path to $185-188, surrounded by holographic technical indicator panels showing mixed signals, multiple timeline ribbons spiraling around scene, golden accumulation particles rising from below, dramatic tension between bullish foundation and bearish storm clouds in cyberpunk space environment

The current technical setup presents a clear make-or-break scenario centered on two critical price levels. Support at $195 must hold to maintain bullish structure integrity, while a decisive break above $200 would confirm trend resumption and likely trigger additional technical buying. The risk-reward profile at current levels favors long positioning, particularly for traders comfortable with tight stop-loss management below $188. However, failure to defend $195 would open the door to deeper retracement toward $185-188 before the next attempt at recovery.

AAVE Bulls Fight Back: Critical $260 Test Ahead (20251014 PM)

AAVE cryptocurrency logo featuring friendly ghost mascot in gradient colors

Our forecast centers on the 270-295 range as the battleground for the next 48 hours, with a bias toward downside continuation unless we see decisive reclamation of 285 with strong volume. Traders should watch for potential short-term bounces from extreme oversold conditions but maintain awareness that the structural bearish setup remains valid until price reclaims and holds above 300, the level we've consistently identified as the bullish invalidation point.

Solana Stands at Critical Crossroads as Bulls and Bears Battle at Key Support.  

Technical indicator signal strength chart for Solana showing MACD, RSI, DMI, SRSI, and CMF scores across six timeframes from 2H to 1W, with values ranging from negative one to positive one indicating bearish to bullish sentiment

Looking ahead, the next twenty-four to forty-eight hours will determine Solana's trajectory through year-end. If bulls can hold the $218-220 support zone and push above $228 resistance, a renewed uptrend targeting $235-240 becomes probable. However, a decisive break below $218 would likely trigger a retest of $210-212 support levels. For now, the battle continues, with both scenarios remaining viable depending on which force wins the war at this critical juncture.

Ethereum Market Insight: The Bear Trap Narrative

Ethereum bear trap analysis chart showing indicator signal scores across six timeframes with short-term bearish readings transitioning to bullish weekly structure on October 9, 202

This divergence between short-term bearishness and medium-to-long-term bullishness created the textbook conditions for a bear trap, where aggressive sellers push price down only to face a swift reversal as stronger hands accumulate at discount levels. Our analysis yesterday correctly anticipated sideways consolidation as price would catch up to faster moving averages before resuming its uptrend, and today's action validates that thesis perfectly.