
Category Crypto Token Analysis

Ethereum: Guarding the Fragile Support Floor- 2026 02 04

ethereum guarding the fragile support floor

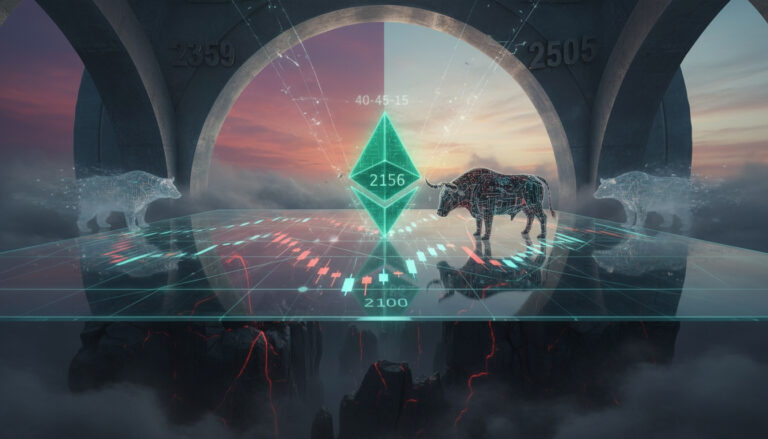
Ethereum closed February 4 at $2,255.96 after testing the critical $2,156 support floor established on February 2the lowest point since the December capitulation. This level represents not just psychological support but a technical inflection point where bulls must defend or risk accelerated downside toward $2,100.

SOLANA TESTS CRITICAL $120 FLOOR AS BEARISH MOMENTUM INTENSIFIES -January 28, 2026 | SOL/USDT Analysis

Digital illustration of a stormy ocean with a lighthouse shaped like a dollar sign projecting colored beams toward a golden bridge marked $125–130, surrounded by labels for support, resistance, accumulation, distribution, liquidations, and bull/bear/base zones in the sky.

Solana trades at $127.17 today, attempting a modest +2.73% intraday recovery from the $118.45 capitulation low tested just 48 hours ago on January 26. Comparing today's structure to our January 22 analysis when SOL consolidated around $130, the breakdown we assigned 35% probability to has materialized with violence—price collapsed through $125, triggering a devastating liquidation event that wiped out $60.89 million in long positions (96.6% of all liquidations) before finding temporary support.

Ethereum’s Relief Rally Meets Reality at Resistance – 2026 01 26

A small golden Ethereum symbol in a metal boat is chained to shadowy hands beneath a stormy red ocean, facing a towering wall of blue Ethereum logos and red candlestick bars under a single beam of light breaking through dark clouds.

Ethereum delivered what many traders were waiting for—a solid +3.2% bounce to $2,906 today, climbing from the $2,811 low we've been watching since mid-January. On the surface, that looks encouraging. The daily candle showed strength, the range expanded to $123, and some intraday indicators like the 2-hour Stochastic RSI rocketed to 94, signaling short-term momentum. But here's where we need to pump the brakes and look at what's really happening beneath the surface.

Bitcoin BTCUSDT.P – Flush Completed, Divergence Building 2026 01 19

A blazing golden Bitcoin symbol rises from a stormy ocean, breaking dark chains as waves crash against rocky pillars carved with the word “FEAR,” while a glowing 96K gate of light shines on the horizon under a starry sky.

Bitcoin consolidates at 92,871 after rejecting 94,407 resistance, locking into a shallow pullback phase that validates yesterday's warning perfectly. Price down 843 points from yesterday's high, but the real story lies beneath the surface where short-term momentum has reversed decisively while medium-term structure holds. This is the exact correction setup we predicted, and it's unfolding tick by tick across your charts.

Solana Racing Ahead—Dramatic Correction Window Opens – 2026 01 14

A glowing Solana coin hovers before a massive metal gate marked “150” at the top of a dark stone staircase lined with green and red lights, while hooded figures stack coins in the shadows under a stormy sky.

Solana closed January 14 at 145.02 after a sharp run from the mid 130s, but today’s multi‑timeframe picture shows an exhausted rally rather than a healthy breakout. Across 2‑hour, 4‑hour, 6‑hour, 12‑hour, and daily charts the same theme repeats: price is racing ahead of its moving averages, momentum oscillators are overbought, and money flow is failing to confirm the move. The 2‑hour Stochastic RSI, which was only threatening a bearish cross earlier, is now clearly rolling over, while the 6‑hour CMF has turned negative even as price pushes higher. That is classic distribution into strength, not fresh accumulation.

Bitcoin’s 92K–94K Compression: Textbook Bullish Correction, Not Breakdown – 2026 01 07

A glowing golden Bitcoin symbol stands on a stone pedestal marked “12H” and “1D” in a rocky canyon, with candlestick charts on the walls and the levels 92,200 and 94,407 carved into the rock under stormy skies

Bitcoin consolidates at 92,871 after rejecting 94,407 resistance, locking into a shallow pullback phase that validates yesterday's warning perfectly. Price down 843 points from yesterday's high, but the real story lies beneath the surface where short-term momentum has reversed decisively while medium-term structure holds. This is the exact correction setup we predicted, and it's unfolding tick by tick across your charts.

Solana Tests the Mid-Range While the Macro Bear Structure Still Calls the Shots – 2026 01 05

Surreal Solana arena where a glowing SOL coin hovers on a cracked stone platform marked 134–135, surrounded by a gloomy stadium with neon price levels 130, 132, 136–144 and a distant gate labeled 150.

Solana is trading around 135.05 today, doing exactly what a structurally bearish market with short-term relief energy tends to do: hovering in the middle of its own battlefield. Our multi‑timeframe FLORECEI levels put the unified floor All-Floor at 134.63 and the first cross‑frame resistance All-Resistance at 136.30, with a tactical ceiling cluster around 144.50. Price is sitting just above that aggregated floor and just below the first real overhead test, which is exactly where indecision and fake comfort live for traders who forget the larger structure.