



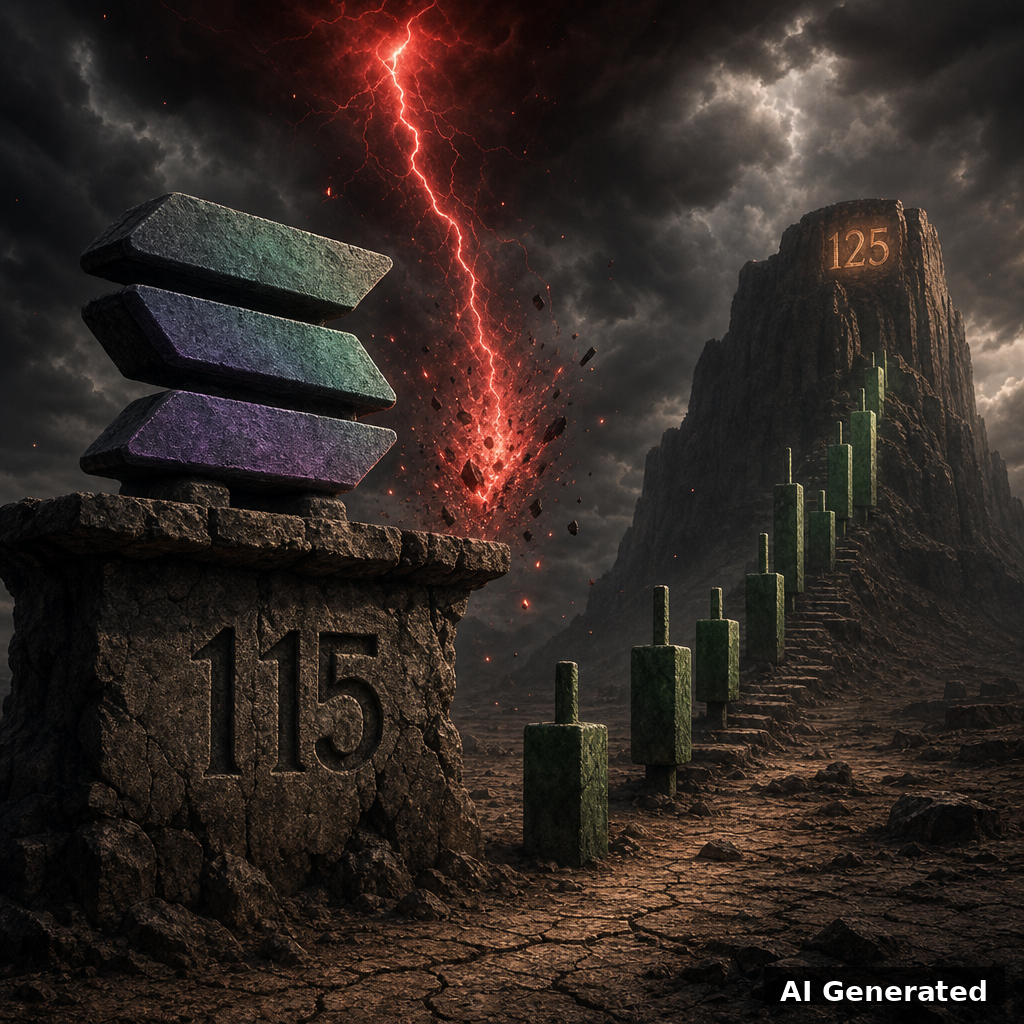

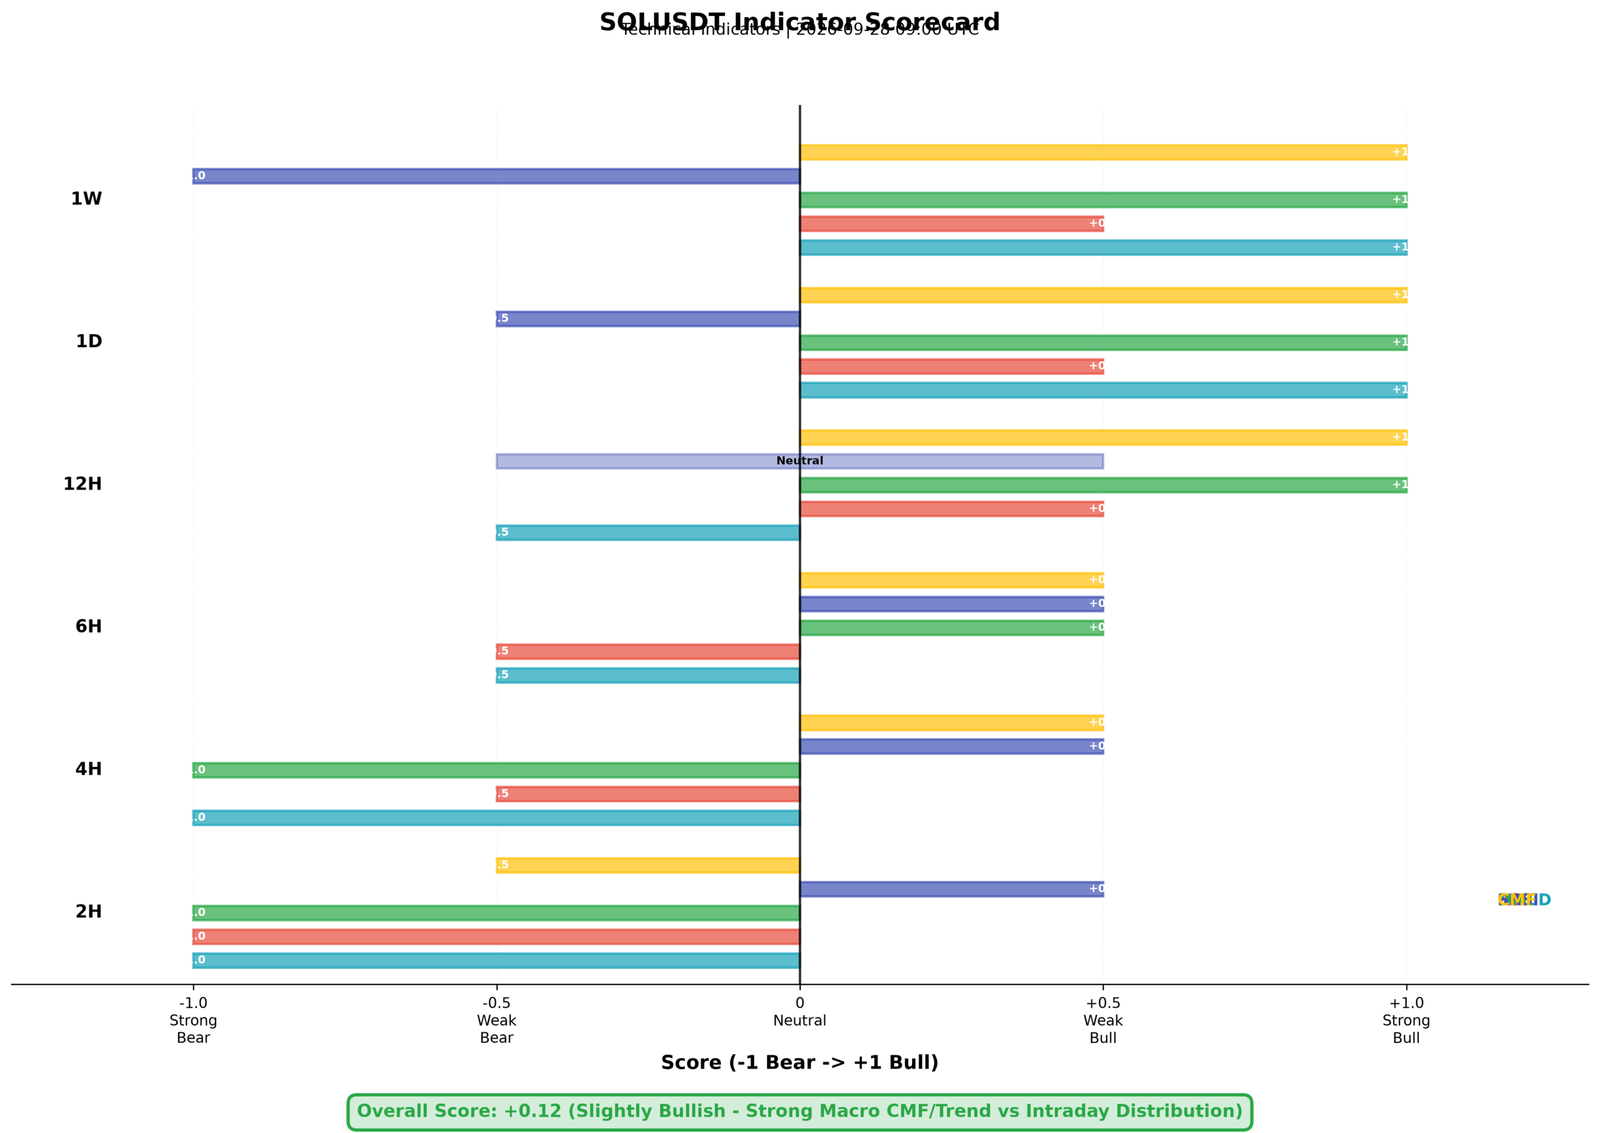
Solana had a remarkable run, surging about 22% before the momentum stalled right near the $125 mark. That was the ceiling we kept an eye on, and it held. The asset has cooled to around $118, a healthy pause rather than a breakdown, but it is a genuine decision point. We are not calling this a top. On the weekly and daily frames the trend is still firmly up: price sits above all of our moving averages on the 6H, 12H, 1D and 1W charts, and the Chaikin Money Flow is strongly positive on every macro frame, which tells us real money is behind this move, not just short covering. The daily MACD is positive and the ADX is over forty, confirming a genuine trend.
The short-term picture is where the caution comes in. The 2H and 4H charts show a pullback with negative MACD histograms and a strongly dominant -DI, and the weekly StochRSI is deeply overbought near 96. That combination historically pulls price sideways or slightly lower for a session or two before the uptrend resumes. There is also a macro wildcard today: the Oval Office speech, plus heavy crypto liquidations and record Solana ETF inflows of nearly $188 million in a week. In conditions like this we weight money flow and weekly momentum more heavily, and we size any position down.
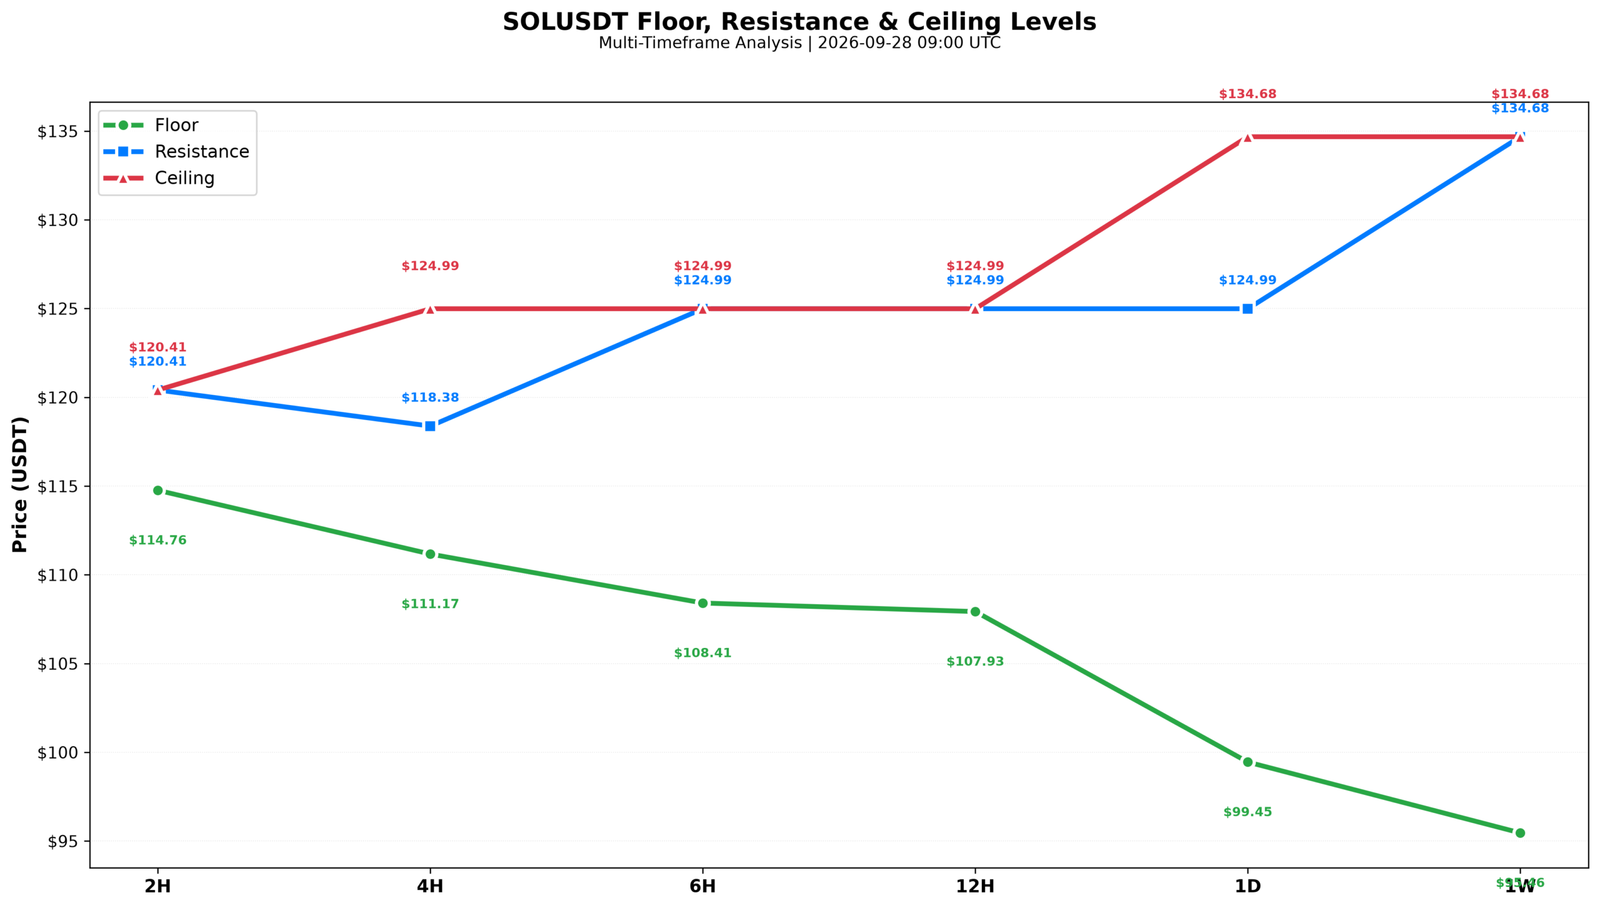
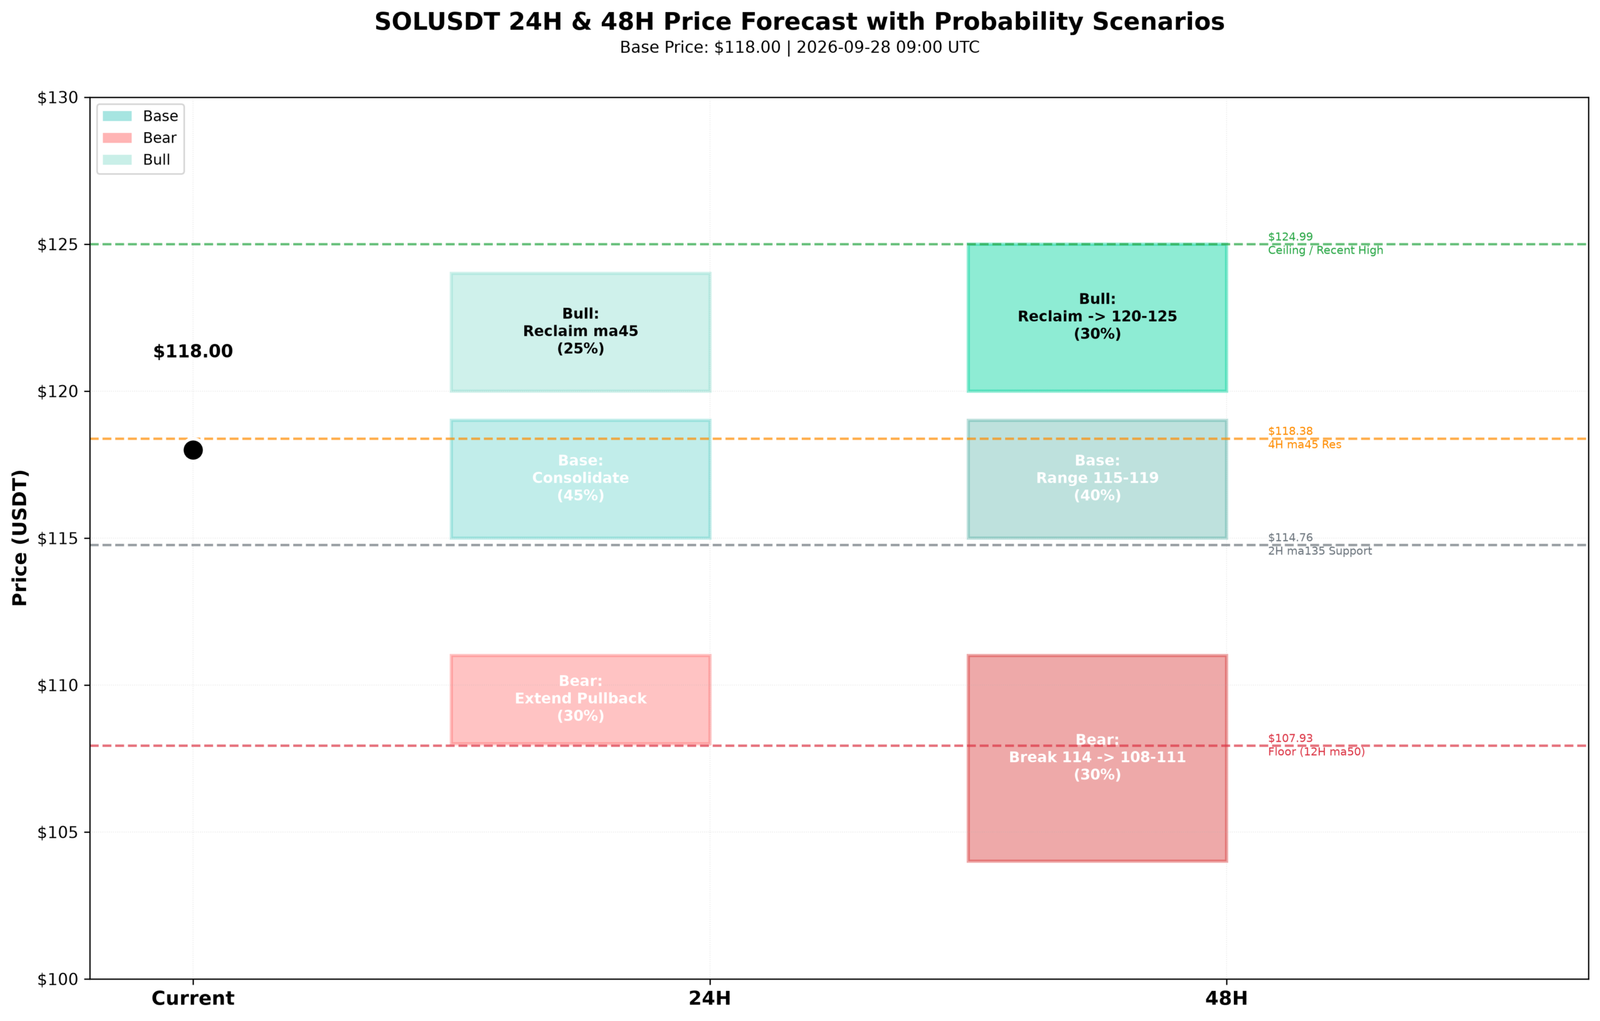
Our 24H view is neutral-to-defensive, expecting consolidation between $115 and $119, with a 30% chance of a deeper dip toward $108 to $111. Into 48H, if the $114-$115 support zone holds with positive money flow, we would look to buy the dip toward $120-$124. If that support gives way, the next real floor sits near $108. We reduce size and wait for confirmation rather than chase. The trend is our friend here, but the pullback deserves respect.
Live Charts & Levels
AI Disclosure: This post was created with the assistance of artificial intelligence. The ideas, analysis, and opinions expressed are my own — AI was used to help compose, structure, and refine my personal notes and thoughts into the final written content. Images, videos and music featured in this post were also generated using AI tools, based on my own creative prompts and direction.
Disclaimer
The content in this publication is for informational and educational purposes only and does not constitute financial, investment, or trading advice. I am not a licensed financial advisor.
Any opinions, strategies, or analyses shared reflect my personal views and experiences. I may hold positions in the cryptocurrencies mentioned (e.g., BTC, ETH, SOL), which could influence my perspective.
Cryptocurrency markets are highly volatile and involve significant risk. Always do your own research and consult a licensed financial advisor before making any investment decisions.
No guarantees are made regarding the accuracy, completeness, or profitability of any information provided. All opinions are subject to change as new information becomes available.
This content is intended for a general audience and may not comply with regulatory standards in your specific country or region. Invest responsibly.
