Solana Holds the Floor — But the Ceiling Has Never Been Further Away – 2026 03 31
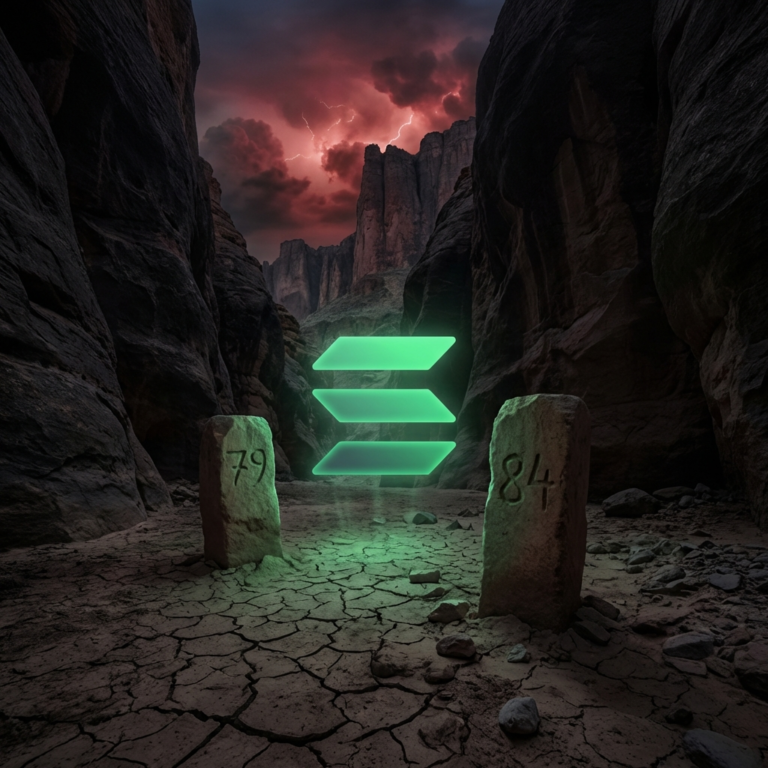
We close out March 31st with Solana trading around $81.60, still deep in bear country and a world away from the $145 peak we analyzed back in January. Today's session offered a brief +1.09% uptick on the 2H candle, but let us be honest — a one-dollar bounce in the middle of a structural downtrend does not change the narrative. The bears remain firmly in control across every timeframe we track. / #SOLUSDT #SolanaAnalysis #CryptoTrading #BearMarket #TechnicalAnalysis #CryptoSignals