Russia’s Skyfall Missile: Threat, Theatre, or Nuclear Omen?
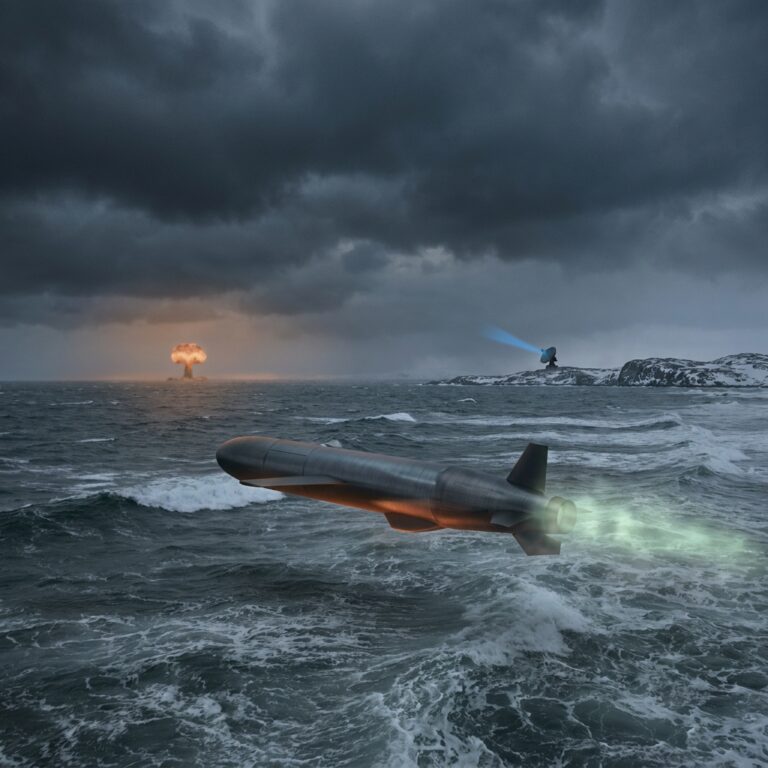
You have heard the name Skyfall. Perhaps it drifted past you in a headline, sandwiched between election polls and economic forecasts. Perhaps you dismissed it — another Russian weapons announcement, another theatrical display from the Kremlin. But you should not dismiss it. Russia's 9M730 Burevestnik — NATO designation SSC-X-9 Skyfall — is a nuclear-powered cruise missile designed to fly for hours, even days, at low altitude with a theoretically unlimited range, evading every missile defense system ever built [1]. It is powered not by conventional fuel but by a miniature nuclear reactor. Burevestnik, #Skyfall, #Russia, #nuclear, #missile, #UkraineWar