Tag cryptocurrency market trends

Bitcoin Fugazi Rally Tests 93k–94k, Weekly Bear Still in Charge

A Bitcoin rocket, powered by charging bulls, surges out of turbulent order‑flow waves only to crash into a glowing 93k–94k resistance wall under looming bearish clouds, symbolizing a powerful but constrained fugazi rally.

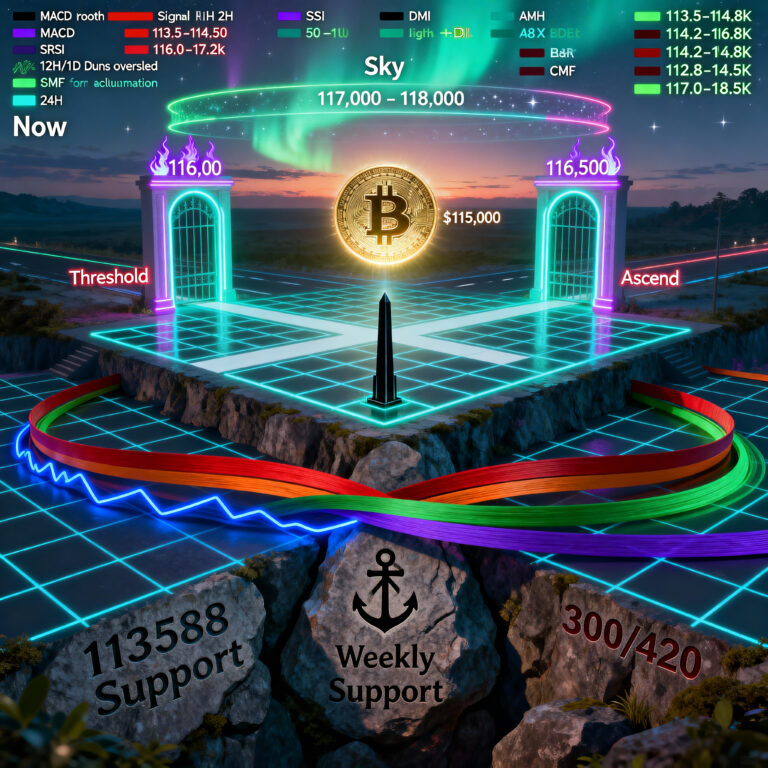
Bitcoin has spent the last sessions grinding higher into the low‑90k band, pressing right into the same 12H resistance zone around 93k that was flagged earlier this month as a “decision level” rather than a clean breakout signal. Short‑term momentum remains constructive across 2H–12H, with MACD and RSI recovering and confirming that bulls have wrestled back control of the intraday tape, but the weekly structure is still firmly bearish with price well below its major moving averages. That combination keeps this move squarely in “fugazi rally” territory for now: real upside energy, but pressing directly into a pre‑defined ceiling cluster rather than breaking the macro trend.

Community Pulse Check: The Crypto Quartet” 2025 11 09

Four iconic figures stand together on a dirt crossroads in a dramatic landscape under a turbulent sky. Each represents a major cryptocurrency: a knight with a Bitcoin shield, a wizard holding an Ethereum staff, a winged sprinter illuminated with Solana stripes, and a cloaked scholar bearing AAVE’s ghost symbol and a map

Shared themes? Every community is talking upgrades—infrastructure for ETH, speed for SOL, security for AAVE, and institutional adoption for BTC. But the difference is clear: Solana and Bitcoin crowds are way more hype-driven, Ethereum’s is optimistic but technical, and AAVE’s is almost clinical in its risk management tone. If you want raw excitement, Solana and BTC are the spots. For sober debate and careful optimism, check ETH and AAVE platforms instead.

Bitcoin’s Technical Tug-of-War: Resistance vs Rejection – 2025 11 11

A golden Bitcoin coin is integrated with a lighthouse on jagged rocks, illuminated against a stormy sea. Lightning and abstract trading chart lines slice the sky, while the waves crash in the foreground. To the right, the label "102K-103K" marks a distant shore, symbolizing support in turbulent conditions.

Despite brief attempts to bounce, the rapid slide to $103,022 put every forecast scenario to the test and ultimately showed that listening to the macro signal, as indicated by the cluster of bearish readings across longer timeframes and previous base observations, was the most prudent and ultimately correct posture. Today, tactical patience triumphed over any urge to chase bullish reversals, and the “Fugazi bounce” theory proved out in real time as predicted. Looking ahead, holding this support determines whether a medium-term relief bounce can materialize or the door opens for a deeper macro flush.

Ethereum at the Crossroads: Support Tested as Bears and Bulls Battle for Direction. 2025 10 30

A golden Ethereum symbol hovers at the center of a cracked, metallic maze strewn with coins, illuminated by rays of sunlight piercing dark storm clouds. Surrounded by ominous bears and shadowy figures on the perimeter, financial charts glow faintly in the background, representing market uncertainty.

Looking ahead to Friday and into the weekend, we anticipate Ethereum faces a binary decision point where either support at $3,800 to $3,850 holds firm and enables a recovery attempt back toward the psychologically significant $4,000 level, or alternatively breaks down to test that critical $3,760 support with potential for cascading stops to push price toward $3,650 if panic selling emerges.

Solana Stands at Critical Crossroads as Bulls and Bears Battle at Key Support.  

Technical indicator signal strength chart for Solana showing MACD, RSI, DMI, SRSI, and CMF scores across six timeframes from 2H to 1W, with values ranging from negative one to positive one indicating bearish to bullish sentiment

Looking ahead, the next twenty-four to forty-eight hours will determine Solana's trajectory through year-end. If bulls can hold the $218-220 support zone and push above $228 resistance, a renewed uptrend targeting $235-240 becomes probable. However, a decisive break below $218 would likely trigger a retest of $210-212 support levels. For now, the battle continues, with both scenarios remaining viable depending on which force wins the war at this critical juncture.

Ethereum Decisively Breaks Out—Multi-Timeframe Bullish Signals Point to New Highs

Ethereum Decisively Breaks Out—Multi-Timeframe Bullish Signals Point to New Highs

Comparing to yesterday, today's session confirms expectations: as forecast, clearing resistance zones near 4,500 has triggered additional buying interest, and the market structure remains well-supported. Predictions of strong uptrend persistence have materialized, with no technical evidence of lasting exhaustion. Looking ahead, the floor for ETH sits above 4,100 across all timeframes, while 4,500–4,600 acts as new support if broken. Should this bullish confluence hold, targets in the 4,800 to 5,000 region are within reach over the coming days. If price stalls at current resistance, the risk scenario would be a controlled pullback or brief consolidation. Overall, the call is long, as both trend and momentum clearly guide the market higher.

BTC: October 2, 2025 – Post Analysis

BTC: October 2, 2025 – Post Analysis

The weekly chart shows continued structural health, as BTC price has not challenged the fastest weekly DEMA. The only modest caution is a slightly negative MACD histogram and flattening ADX, signaling trend moderation. However, SRSI and DMI are recovering while CMF holds above zero, suggesting that after a brief pause or grind, BTC remains positioned for a reach toward the ambitious 122,000 area in coming weeks, as both cross-timeframe technicals and multi-week trend behavior point in that direction