

Double click on the video for full screen!!
SOLANA TESTS CRITICAL $120 FLOOR AS BEARISH MOMENTUM INTENSIFIES
January 28, 2026 | SOL/USDT Analysis
Solana trades at $127.17 today, attempting a modest +2.73% intraday recovery from the $118.45 capitulation low tested just 48 hours ago on January 26. Comparing today’s structure to our January 22 analysis when SOL consolidated around $130, the breakdown we assigned 35% probability to has materialized with violence—price collapsed through $125, triggering a devastating liquidation event that wiped out $60.89 million in long positions (96.6% of all liquidations) before finding temporary support.
The technical picture presents what experienced traders recognize as distribution masquerading as recovery. While price bounced +7.3% from the low, our multi-timeframe scorecard reveals persistent weakness: Stochastic RSI shows extreme overbought exhaustion on 2H-12H timeframes (K-values 86-96), yet Chaikin Money Flow remains negative across ALL frames—ranging from -0.11 on 2H to -0.26 on 12H—confirming this rally is being sold into by institutional players rather than accumulated.
The money flow divergence tells the real story. When price rises +7% but CMF stays deeply negative on higher timeframes, it signals classic distribution: smart money using bounces as exit liquidity. The 12H CMF at -0.26 represents the worst reading in the bottom 5th percentile of the past 90 days, while open interest collapsed from $17 billion (September 2025) to $7.6 billion today—a 56% contraction reflecting mass exodus of leveraged participants.
Yet beneath this bearish structure lies a paradox: Solana’s fundamentals remain robust. Staking hit an all-time high of 70% ($60 billion locked), stablecoin liquidity surged to $15 billion (+15% in 7 days), daily active addresses spiked 51% to 5 million, and DEX volume reached $1.6 trillion annually. Whale wallets continue accumulating despite the decline—Santiment’s behavioral confidence score stands at 70%, with repeated $10M+ SOL purchases at $125-135 levels.
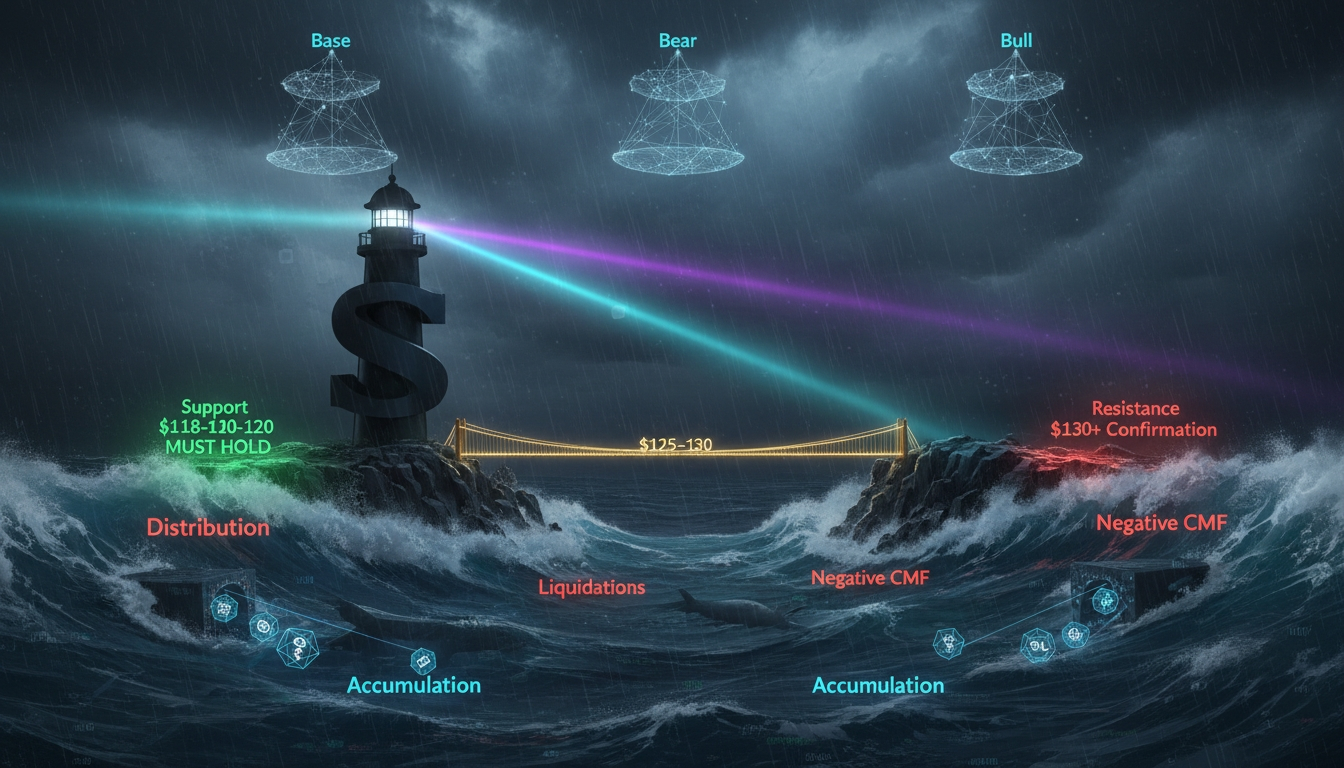
Bottom Line: SOL sits at a tactical inflection where extreme overbought intraday momentum collides with persistent institutional distribution and critical $118-120 floor support. The 80% probability of consolidation/pullback over 48H argues against chasing longs. Respect the structure—let price prove itself by reclaiming $130+ with volume before considering bullish positions.
#Solana #SOL #CryptoTrading #TechnicalAnalysis #SOLUSDT #CryptoMarkets
SOL/USDT Perpetual (Bybit)
Technical Analysis for SOL/USDT.P
Advanced Chart for SOL/USDT.P
This chart visually represents the consensus indicator scores across all analyzed timeframes, providing a clear, at-a-glance view of the prevailing market sentiment.
-1 = Bearish 🧸 ,+1=Bullish 🐂 ,+-0.5 weak Bullish/Bearish , 0(0.5-0.5) = Neutral
This chart plots the key price levels—floor, resistance, and ceiling—that we identified for each timeframe. It helps in visualizing the critical support and resistance zones.
Disclaimer
The content in this publication is for informational and educational purposes only and does not constitute financial, investment, or trading advice. I am not a licensed financial advisor.
Any opinions, strategies, or analyses shared reflect my personal views and experiences. I may hold positions in the cryptocurrencies mentioned (e.g., BTC, ETH, SOL), which could influence my perspective.
Cryptocurrency markets are highly volatile and involve significant risk. Always do your own research and consult a licensed financial advisor before making any investment decisions.
No guarantees are made regarding the accuracy, completeness, or profitability of any information provided. All opinions are subject to change as new information becomes available.
This content is intended for a general audience and may not comply with regulatory standards in your specific country or region. Invest responsibly.
