

Solana Stands at Critical Crossroads as Bulls and Bears Battle at Key Support
Solana found itself locked in an intense technical battle today, hovering precariously around the $222-225 range after testing critical support levels throughout the week. Yesterday’s analysis correctly identified the $220 zone as a make-or-break level, and today’s price action confirms just how pivotal this support has become. While we anticipated potential volatility, the market delivered exactly what the indicators suggested—a tug-of-war between bullish and bearish forces with neither side gaining decisive control.
Lower timeframes tell a predominantly bearish story. The two-hour and four-hour charts show price struggling below key DEMA resistance levels, with RSI readings dipping into the low forties and negative money flow on the four-hour suggesting selling pressure. However, these bearish signals come with a crucial caveat—the MACD on both timeframes remains stubbornly flat near zero rather than diving deeper into negative territory. This flatness suggests bulls are actively defending, preventing a complete capitulation. The six-hour chart reinforces this defensive stance, showing DEMAs converging in what appears to be consolidation rather than collapse.
The higher timeframes paint a different picture entirely. The twelve-hour and daily charts maintain clear uptrend structures in their slower-moving DEMAs, with the critical DEMA 140 support sitting precisely at $220.87. Strong bullish money flow readings of 0.14 on the twelve-hour combined with oversold Stochastic RSI conditions create a compelling case for potential reversal. Yesterday we cautioned about mixed signals, and today those signals crystallized into a clear inflection point.
Looking ahead, the next twenty-four to forty-eight hours will determine Solana’s trajectory through year-end. If bulls can hold the $218-220 support zone and push above $228 resistance, a renewed uptrend targeting $235-240 becomes probable. However, a decisive break below $218 would likely trigger a retest of $210-212 support levels. For now, the battle continues, with both scenarios remaining viable depending on which force wins the war at this critical juncture.
#Solana #SOL #CryptoAnalysis #TechnicalAnalysis #CryptoTrading #AltcoinWatch
SOL/USDT Perpetual (Bybit)
Technical Analysis for SOL/USDT.P
Advanced Chart for SOL/USDT.P
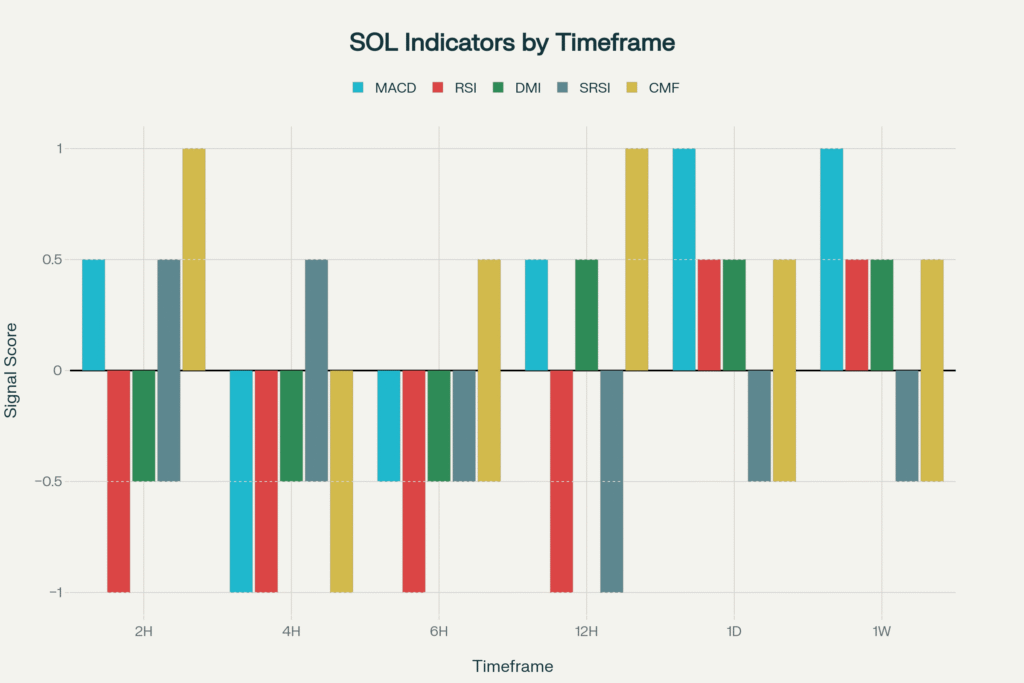
This chart visually represents the consensus indicator scores across all analyzed timeframes, providing a clear, at-a-glance view of the prevailing market sentiment.
-1 = Bearish 🧸 ,+1=Bullish 🐂 ,+-0.5 weak Bullish/Bearish , 0(0.5-0.5) = Neutral
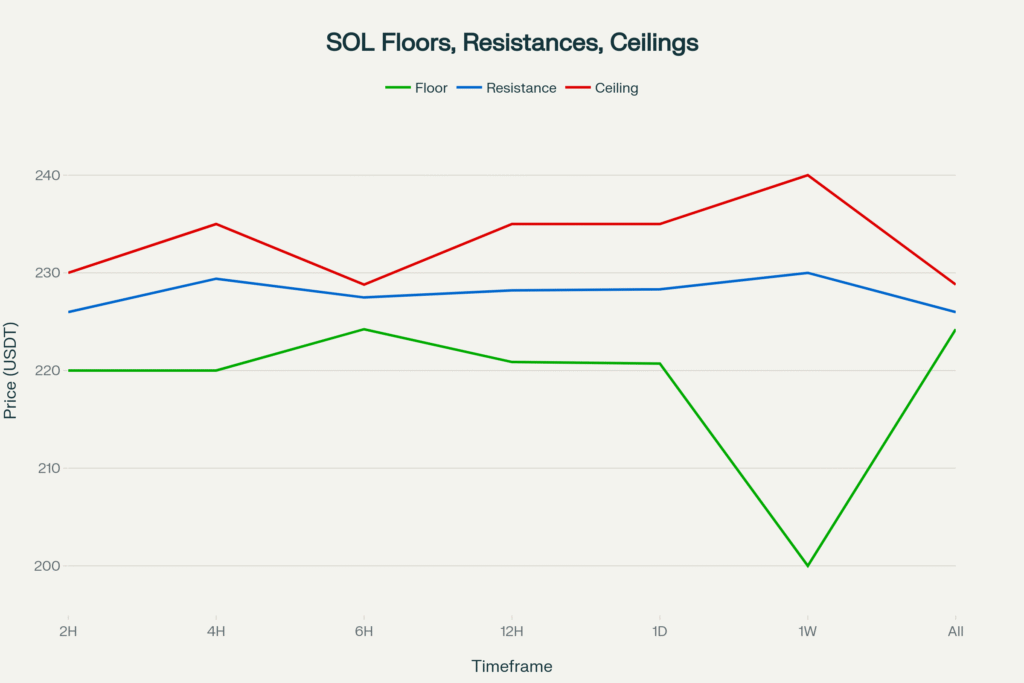
This chart plots the key price levels—floor, resistance, and ceiling—that we identified for each timeframe. It helps in visualizing the critical support and resistance zones.
Disclaimer
The content in this publication is for informational and educational purposes only and does not constitute financial, investment, or trading advice. I am not a licensed financial advisor.
Any opinions, strategies, or analyses shared reflect my personal views and experiences. I may hold positions in the cryptocurrencies mentioned (e.g., BTC, ETH, SOL), which could influence my perspective.
Cryptocurrency markets are highly volatile and involve significant risk. Always do your own research and consult a licensed financial advisor before making any investment decisions.
No guarantees are made regarding the accuracy, completeness, or profitability of any information provided. All opinions are subject to change as new information becomes available.
This content is intended for a general audience and may not comply with regulatory standards in your specific country or region. Invest responsibly.
