

SOL analysis what is see wht may come 13-05-2025
What I see :
🔶 12H Chart
Price: 171.54
DEMA Levels:
DEMA 70 = 159.51 ✅ Confirmed breakout
DEMA 140 = 163.44 ✅ Retested as support
DEMA 210 = 170.54 ✅ Holding above
DEMA 420 = 177.50 ← Next major resistance
MACD: Bullish momentum, but histogram flattening
RSI: 66.9 → Approaching overbought zone
ADX: Strong +DI separation, trend is powerful
Stoch RSI: Just crossed downward from 72 → sign of short-term cooling
📌 Conclusion: Strong uptrend but short-term overbought. Could pull back to 168–170 before next push.
🔷 1D Chart
Price: 171.60
DEMA Levels:
DEMA 70 = 154.36 ✅ Strong breakout
DEMA 140 = 160.71 ✅ Cleared resistance
DEMA 210 = 170.13 ✅ Current support level
DEMA 420 = 180.93 ← Major target
MACD: Strong bullish divergence, histogram still growing
RSI: 68.28 (just below overbought)
Stoch RSI: 81.80 → Overbought and may cross down
ADX: Very strong trend; +DI clearly dominant
📌 Conclusion: Still bullish — 180 is realistic within 2–5 days if 170+ holds. Needs cooling short-term.
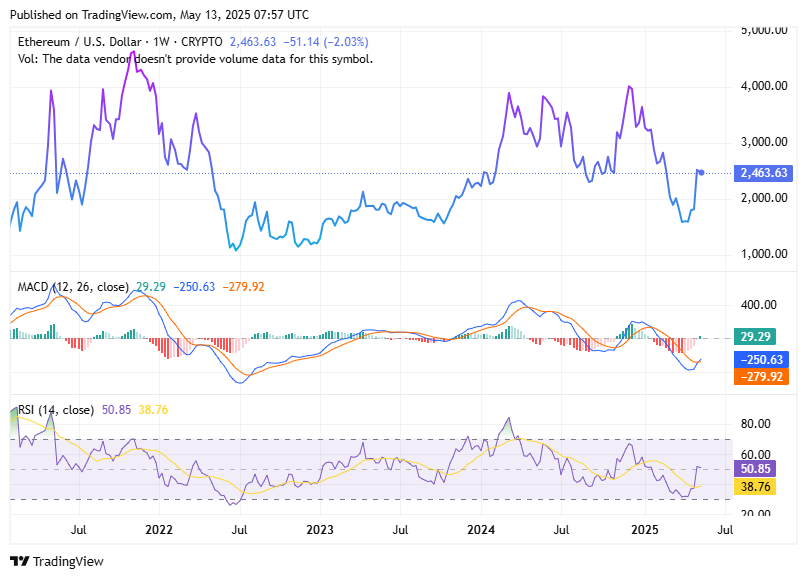
🟣 1W Chart
Price: 173.07
DEMA Levels:
DEMA 70 = 158.93 ✅ Support confirmed last week
DEMA 140 = 163.44 ✅ Retested and held
DEMA 210 = 180.93 ← Strong weekly ceiling
DEMA 420 = 186.03 ← Max range for current wave
MACD: Still bearish but flattening
RSI: 52.06 → Back in bullish territory
Stoch RSI: 85.81 → Very overbought
ADX: Turning flat but neutral strength
📌 Conclusion: Recovery confirmed on weekly. But reaching macro resistance — 180–186 will be hard to break on first try.
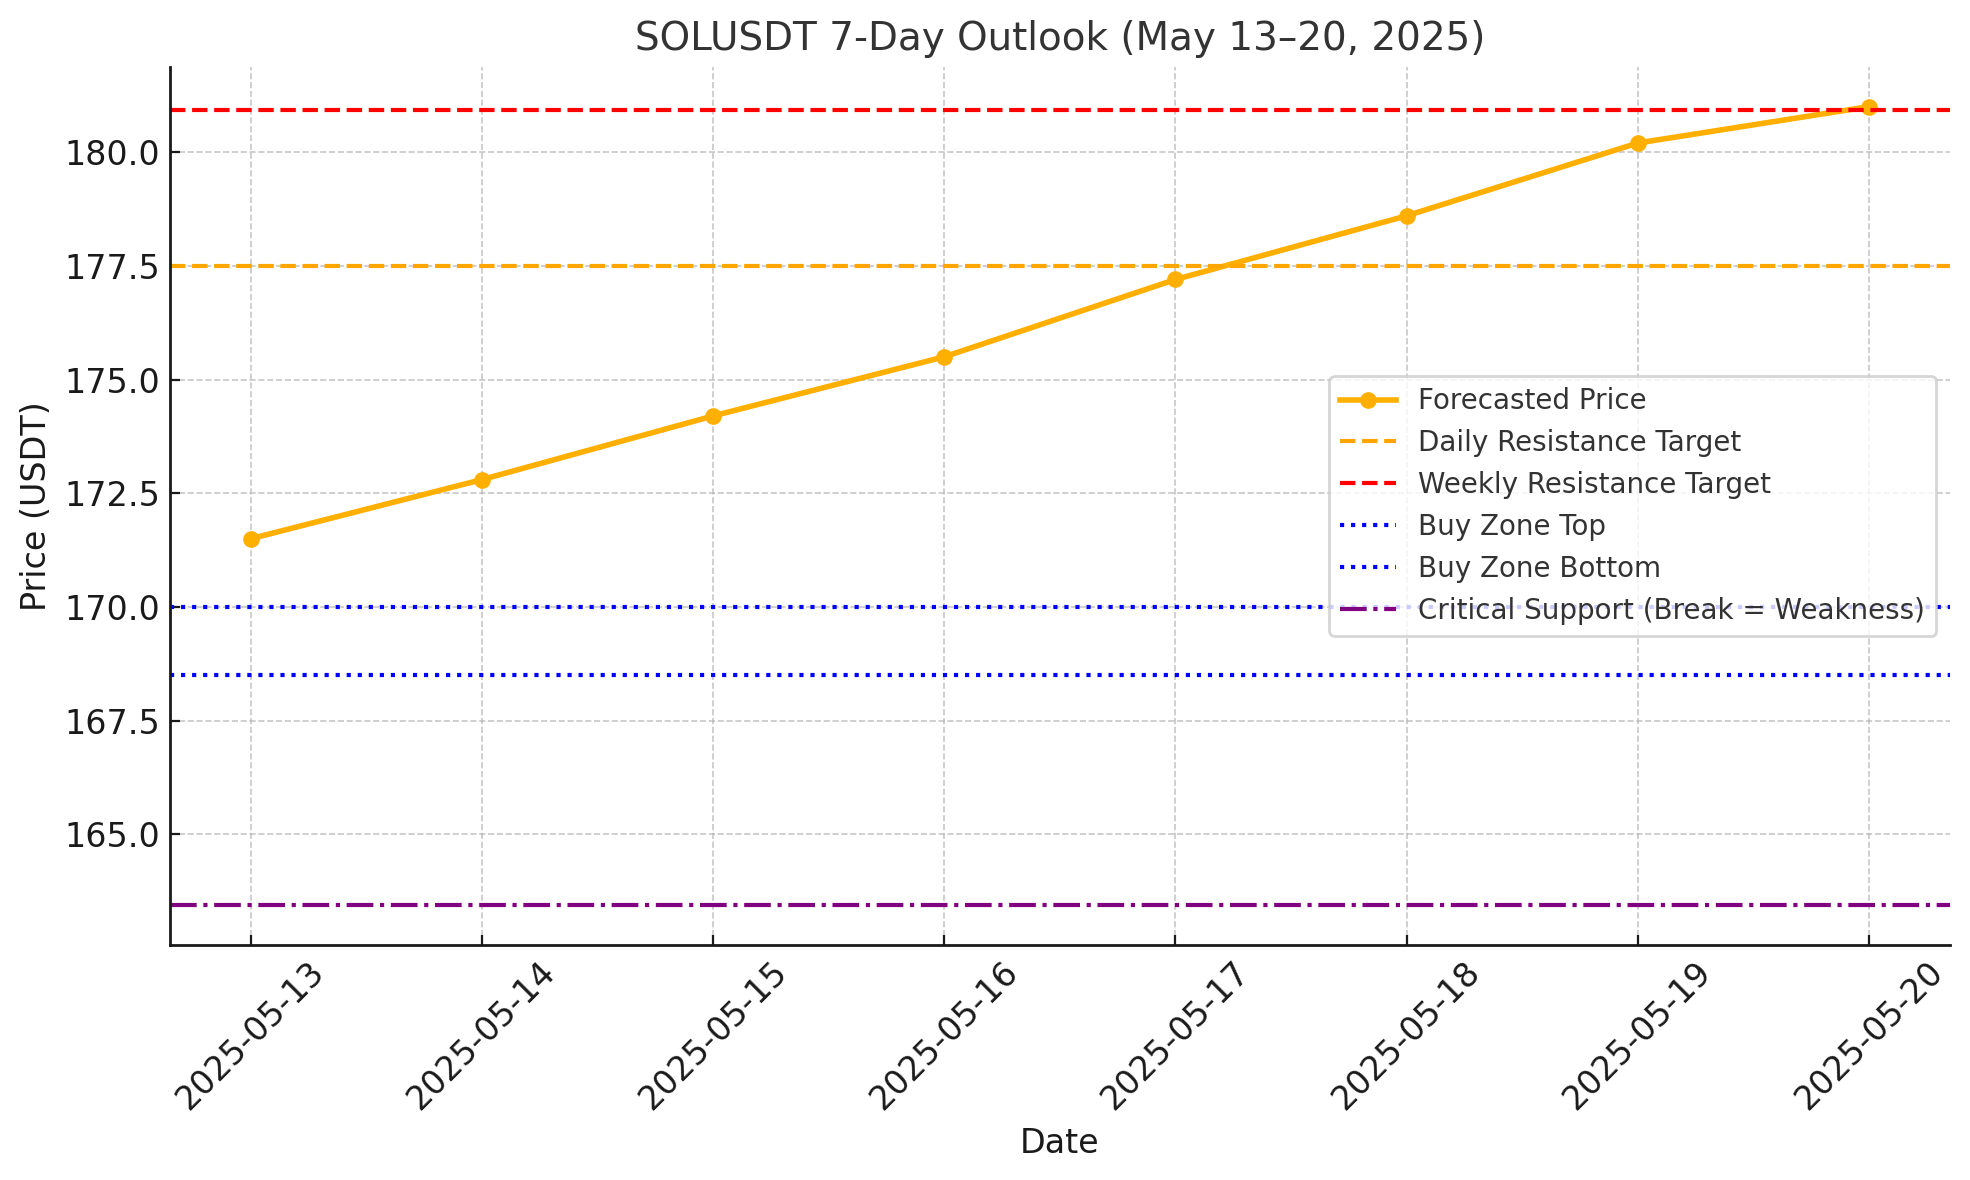
🔮 7-Day Outlook Summary (May 13–20, 2025)
Factor Forecast Main Trend ✅ Bullish with overbought cooling Short-term pullback zone 168.50–170.00 Daily upside target 175.15 → 177.50 Weekly upside target 180.93 → max 186.03 Critical support 163.44 (break = weakness) Strategy Buy dips above 170, TP 177–180 Bearish invalidation Below 163.44 with volume
📜 Disclaimer
The content in this publication is for informational and educational purposes only and does not constitute financial, investment, or trading advice. I am not a licensed financial advisor.
Any opinions, strategies, or analyses shared reflect my personal views and experiences. I may hold positions in the cryptocurrencies mentioned (e.g., BTC, ETH, SOL), which could influence my perspective.
Cryptocurrency markets are highly volatile and involve significant risk. Always do your own research and consult a licensed financial advisor before making any investment decisions.
No guarantees are made regarding the accuracy, completeness, or profitability of any information provided. All opinions are subject to change as new information becomes available.
This content is intended for a general audience and may not comply with regulatory standards in your specific country or region. Invest responsibly.
