




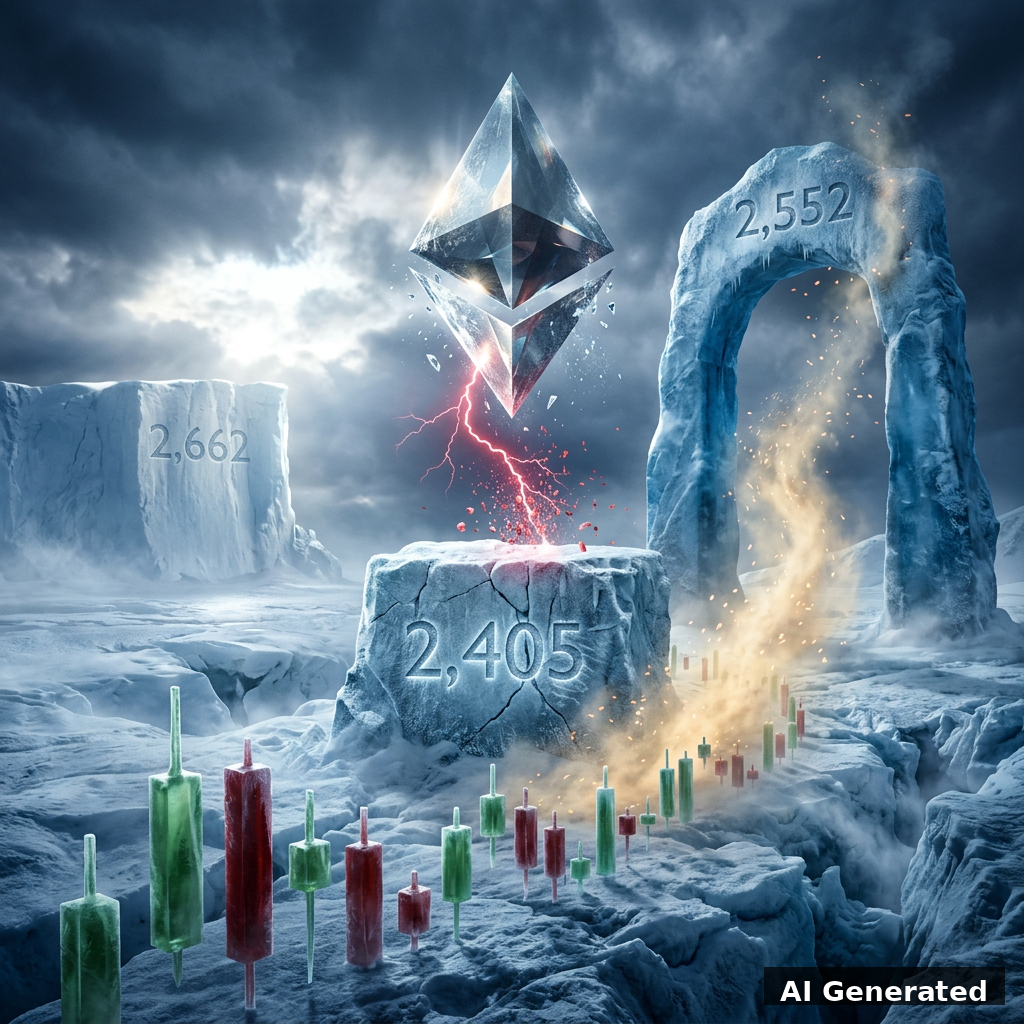

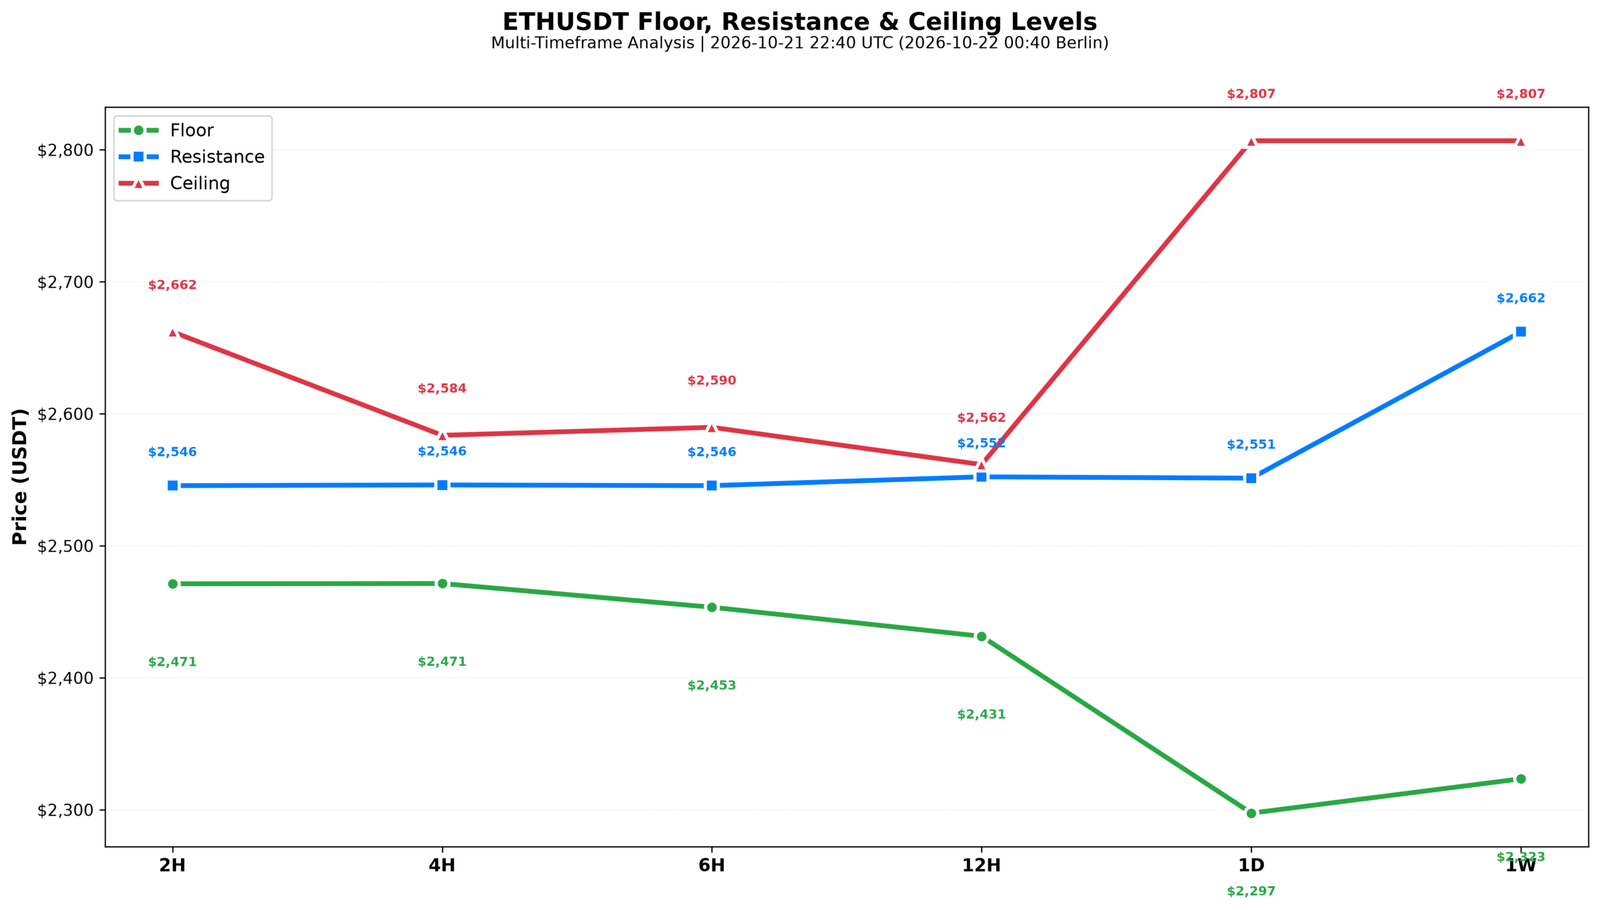
Ethereum has staged a solid recovery session, lifting back to roughly $2,489 after the deeper flush we called last Sunday. Our analysis reads this as a relief bounce inside a still-bearish daily structure rather than a clean trend turn. Price has reclaimed the $2,405 floor and sits above the daily moving average we track at $2,297, but it is now running into a cluster of resistance between $2,545 and $2,552 where the 6-hour, 12-hour and daily moving averages all converge. That triple confluence is the key test for the next move.
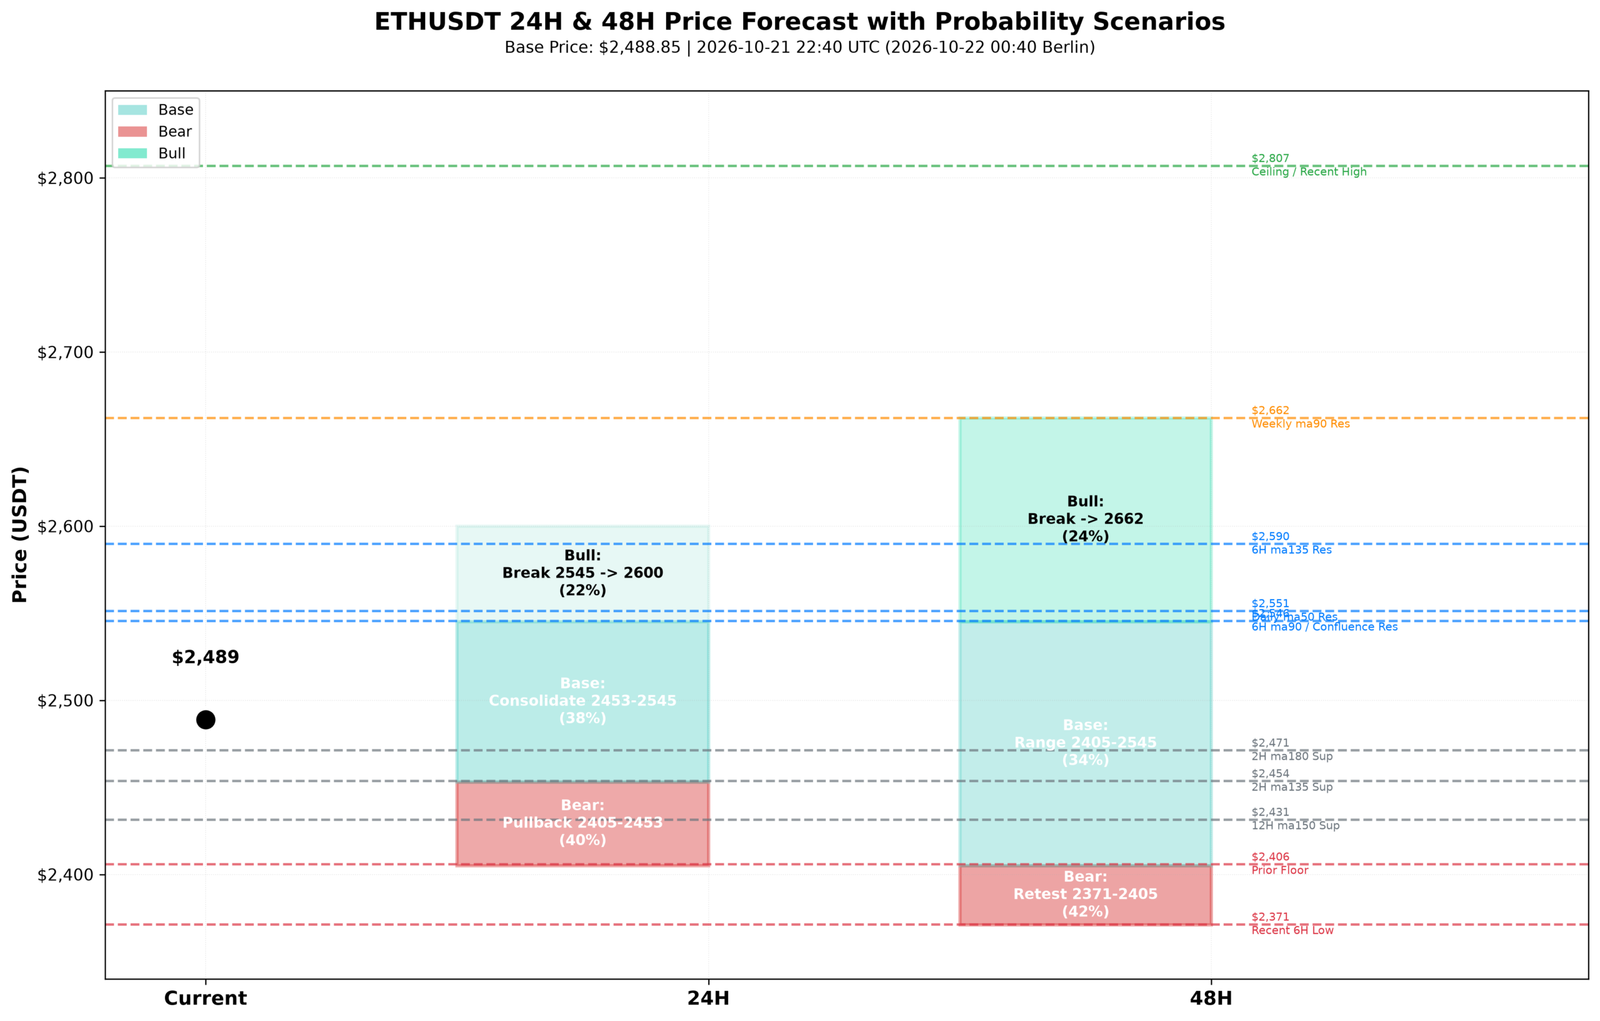
Looking back at our last session, we leaned SHORT from $2,392. The 24-hour call landed as a hit because price flushed to $2,327, inside the target band we had set, while the 48-hour call was a miss as the market reversed and pushed toward $2,489. The lesson is that the oversold daily StochRSI kept producing sharp bounces that capped how far the short could travel, and we should respect that pullback risk on multi-session shorts.
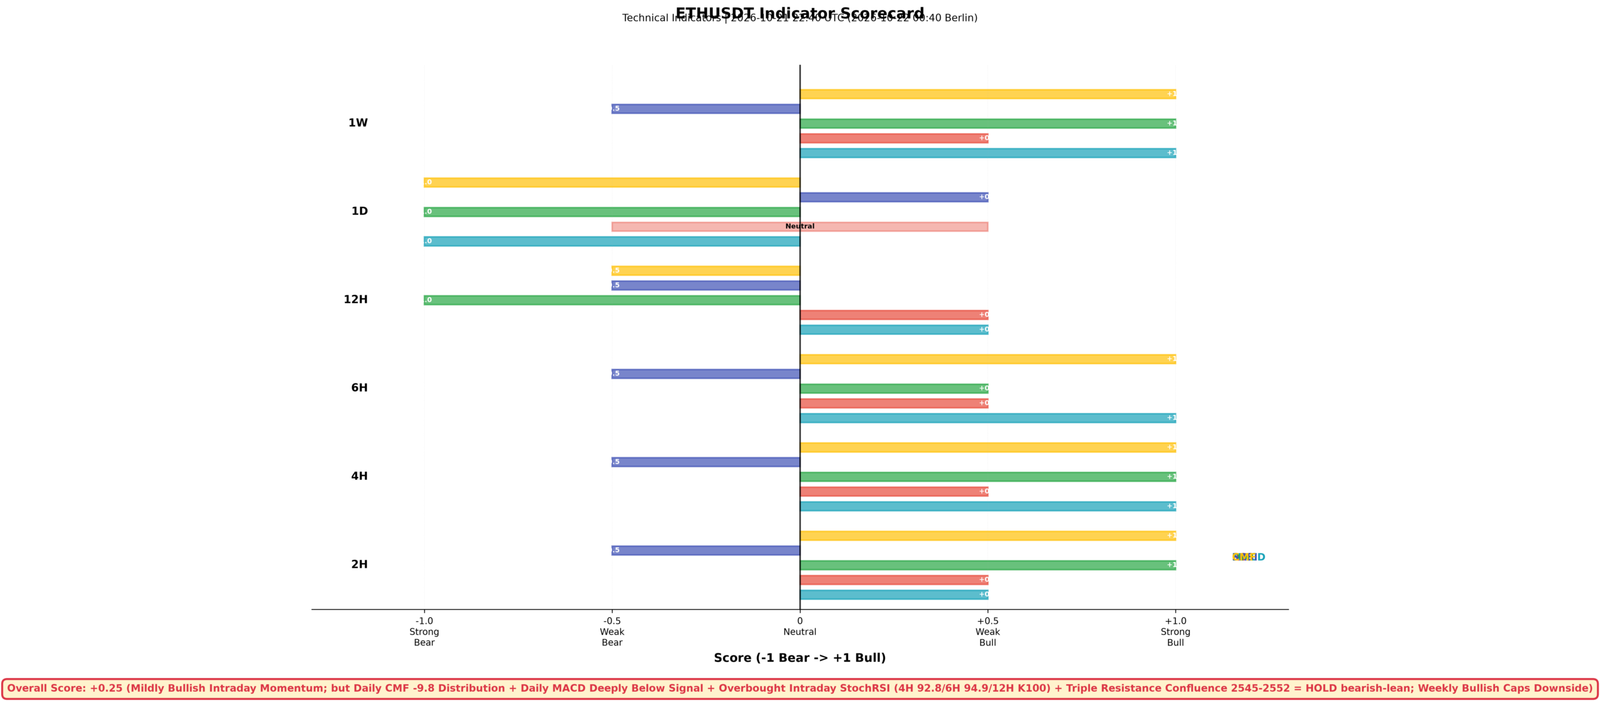
The intraday frames are bullish but overbought. The 4-hour and 6-hour StochRSI are both near the top of the range, and the 12-hour is pegged at 100, so we expect consolidation or a pullback within the next couple of sessions before any further leg. The daily Chaikin Money Flow is still printing a negative distribution reading, which is the hot-air balloon warning we keep repeating: a rally that climbs without money-flow support tends to deflate. ETF outflows have now run for fifteen straight sessions, yet price keeps defying them, and that divergence makes us cautious about chasing.
We are holding a bearish-lean stance, fading strength into the $2,545 to $2,552 zone rather than buying the breakout on the first attempt. A confirmed daily close above $2,552 with rising money flow would change our read. Next steps are to watch that confluence and the $2,405 floor. The weekly frame stays bullish and caps the downside, so we are not positioned for a collapse.
Live Charts & Levels
AI Disclosure: This post was created with the assistance of artificial intelligence. The ideas, analysis, and opinions expressed are my own — AI was used to help compose, structure, and refine my personal notes and thoughts into the final written content. Images, videos and music featured in this post were also generated using AI tools, based on my own creative prompts and direction.
Disclaimer
The content in this publication is for informational and educational purposes only and does not constitute financial, investment, or trading advice. I am not a licensed financial advisor.
Any opinions, strategies, or analyses shared reflect my personal views and experiences. I may hold positions in the cryptocurrencies mentioned (e.g., BTC, ETH, SOL), which could influence my perspective.
Cryptocurrency markets are highly volatile and involve significant risk. Always do your own research and consult a licensed financial advisor before making any investment decisions.
No guarantees are made regarding the accuracy, completeness, or profitability of any information provided. All opinions are subject to change as new information becomes available.
This content is intended for a general audience and may not comply with regulatory standards in your specific country or region. Invest responsibly.
