




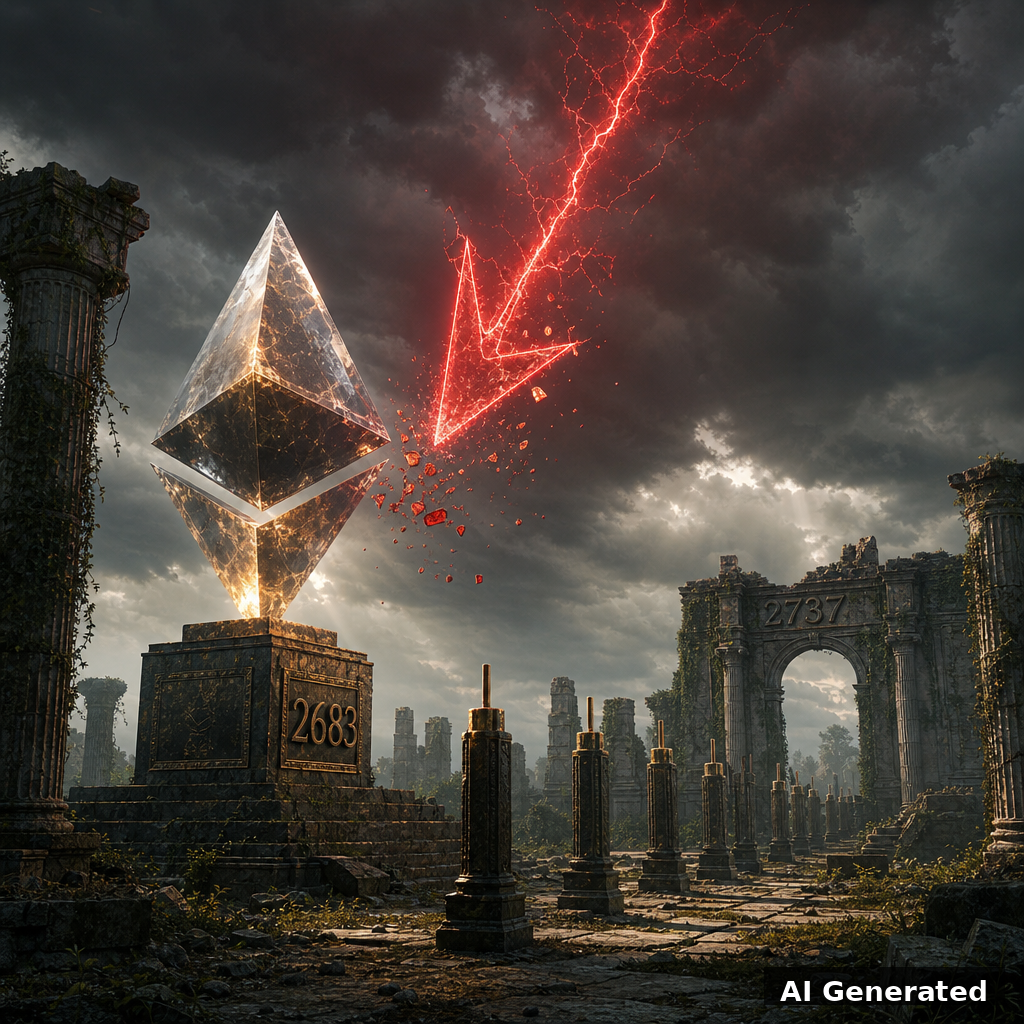

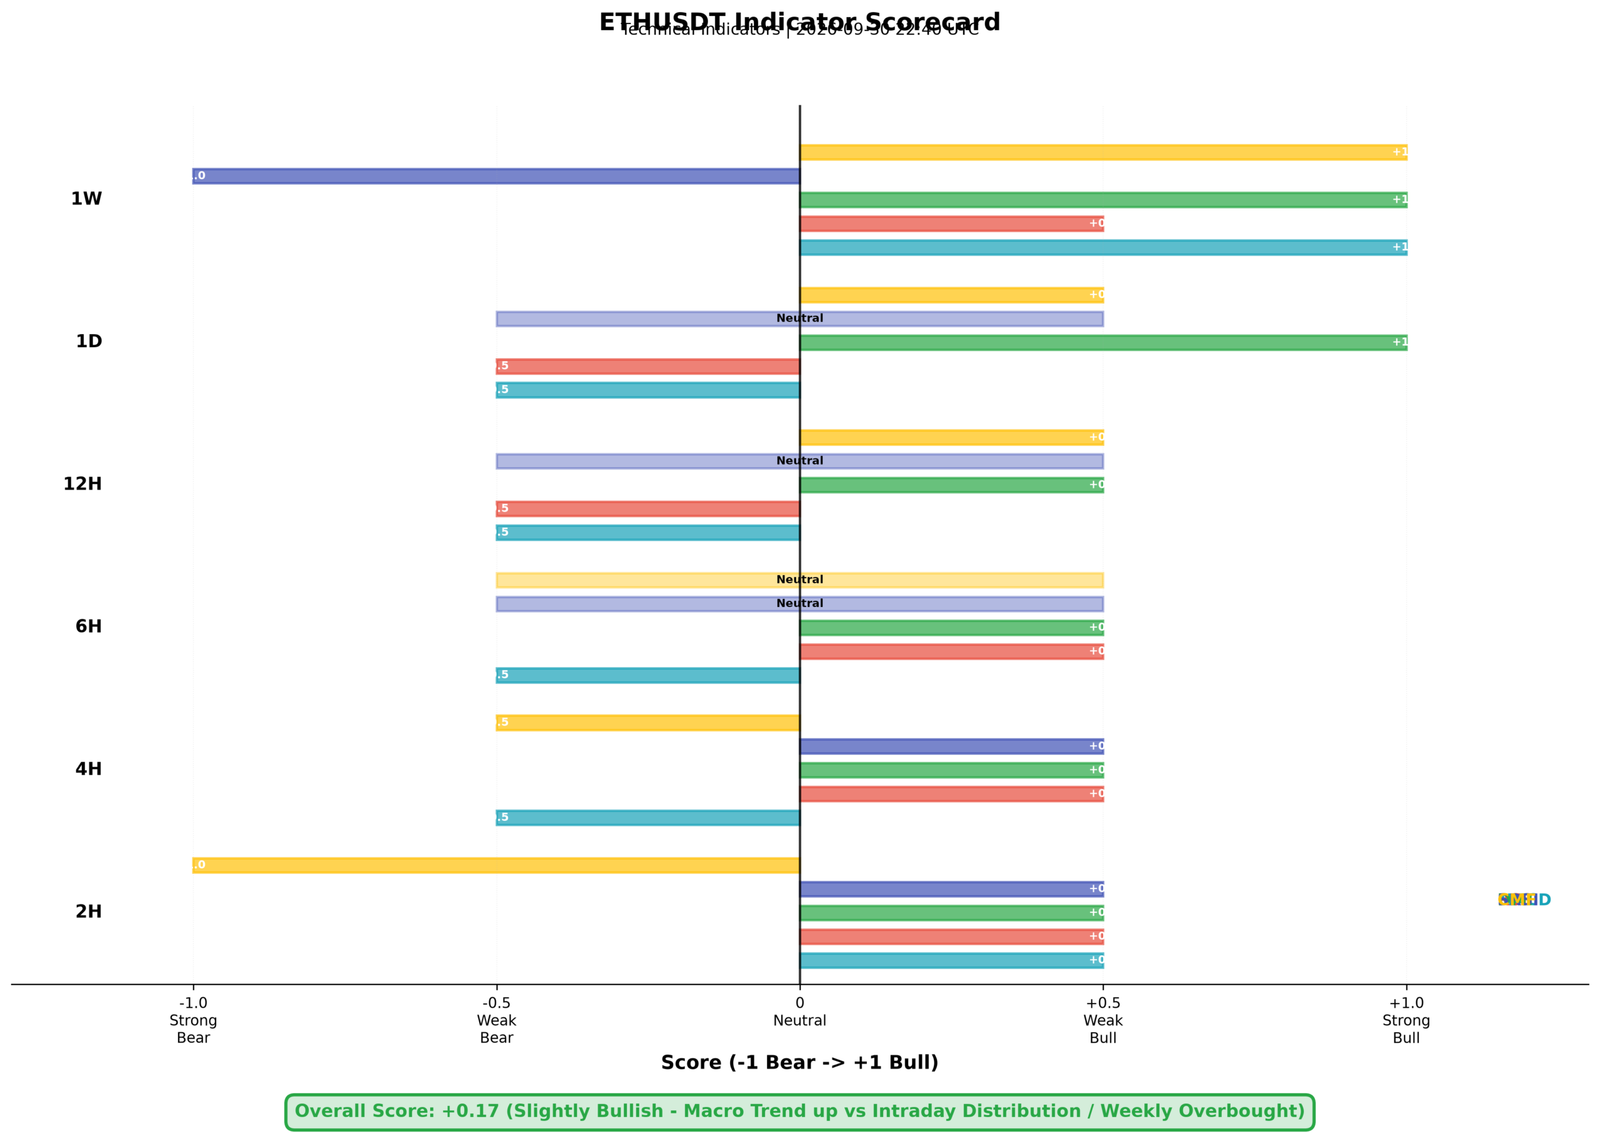
Ethereum is holding its ground just above the 2,683 weekly moving average, and our analysis sees a market that has cooled from its recent surge without surrendering the broader bullish structure. After touching 2,749 on September 29, ETH pulled back to trade near 2,690, and every major timeframe now sits above its moving-average cluster. The daily and weekly ADX readings, both above 40, confirm a genuine uptrend, while Chaikin money flow stays positive on the 12-hour, daily and weekly charts, telling us the buying is real accumulation rather than short covering. That distinction shapes our sizing for the next session.
Yet we cannot ignore the warning lights. The weekly Stochastic RSI has pushed to an extreme 100, and per our learned rule this normally precedes a consolidation or pullback within a session or two. On the shorter 2-hour and 4-hour charts, money flow has turned negative even as price held firm, which is exactly the distribution signature we have learned to respect. Momentum on the 4-hour, 12-hour and daily MACD histograms has also cooled, so the immediate upside is limited. For now the balance of evidence favors patience over aggression.
Our previous 24-hour call was a hold, and it resolved as a partial: price stayed inside our base band at the endpoint, but it ran much higher than we anticipated before returning. That taught us to widen our base band when an overbought weekly reading collides with a strong macro trend.
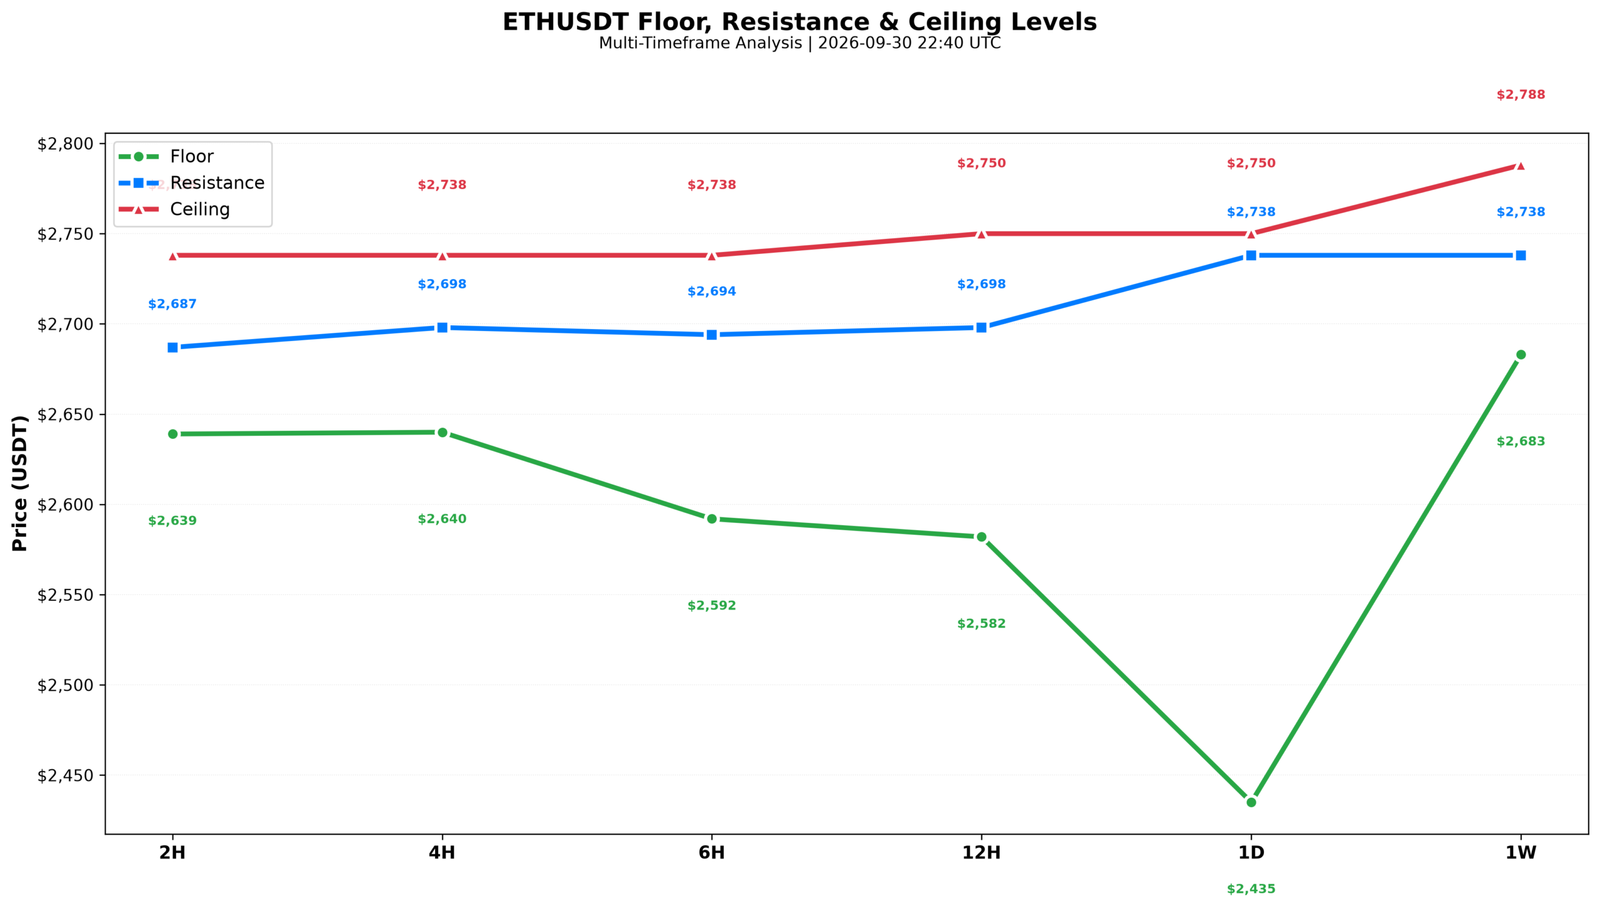
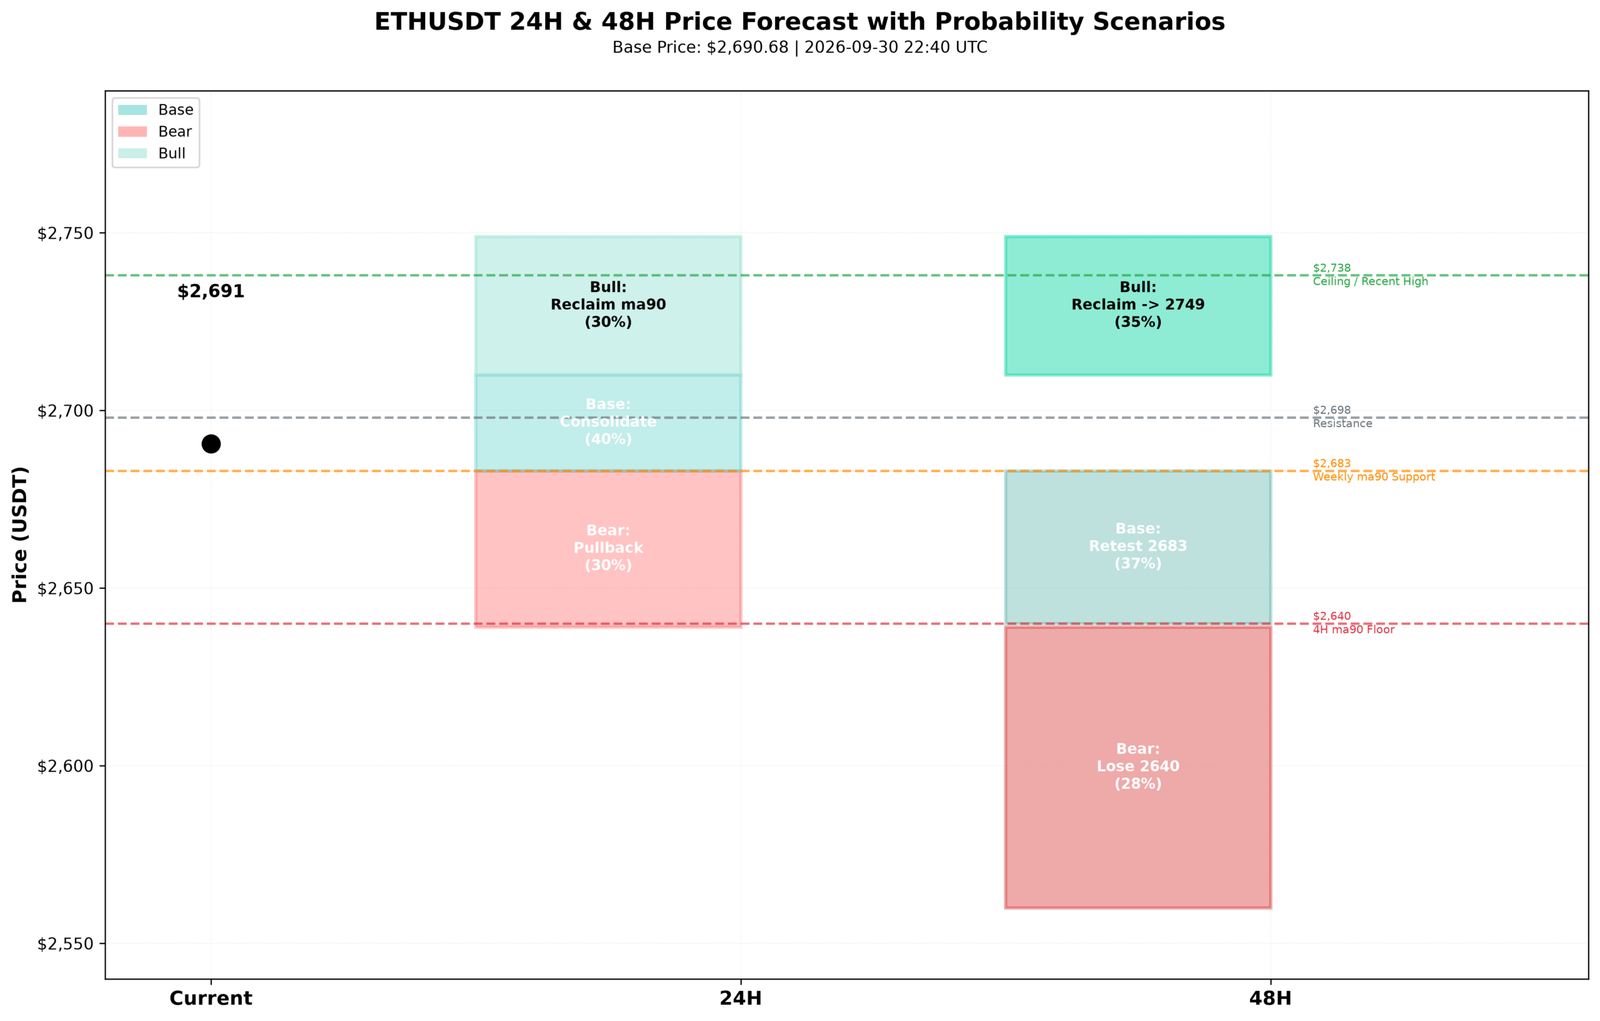
For the next 24 hours we lean hold, expecting consolidation between 2,683 and 2,710, with a pullback risk toward 2,639 if the short-term distribution plays out. Beyond that, a conditional long on a successful retest of the 2,640 to 2,683 support zone could target 2,737 and 2,749. We reduce size in this conflict zone and wait for confirmation before committing.
Live Charts & Levels
AI Disclosure: This post was created with the assistance of artificial intelligence. The ideas, analysis, and opinions expressed are my own — AI was used to help compose, structure, and refine my personal notes and thoughts into the final written content. Images, videos and music featured in this post were also generated using AI tools, based on my own creative prompts and direction.
Disclaimer
The content in this publication is for informational and educational purposes only and does not constitute financial, investment, or trading advice. I am not a licensed financial advisor.
Any opinions, strategies, or analyses shared reflect my personal views and experiences. I may hold positions in the cryptocurrencies mentioned (e.g., BTC, ETH, SOL), which could influence my perspective.
Cryptocurrency markets are highly volatile and involve significant risk. Always do your own research and consult a licensed financial advisor before making any investment decisions.
No guarantees are made regarding the accuracy, completeness, or profitability of any information provided. All opinions are subject to change as new information becomes available.
This content is intended for a general audience and may not comply with regulatory standards in your specific country or region. Invest responsibly.
