Category Crypto Token Analysis

Ethereum Decisively Breaks Out—Multi-Timeframe Bullish Signals Point to New Highs

Ethereum Decisively Breaks Out—Multi-Timeframe Bullish Signals Point to New Highs

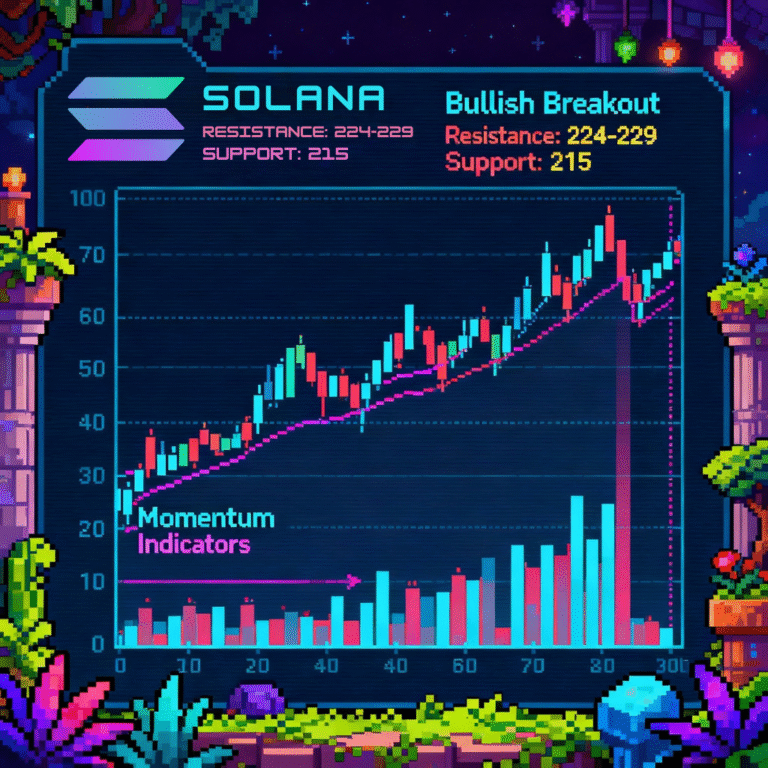
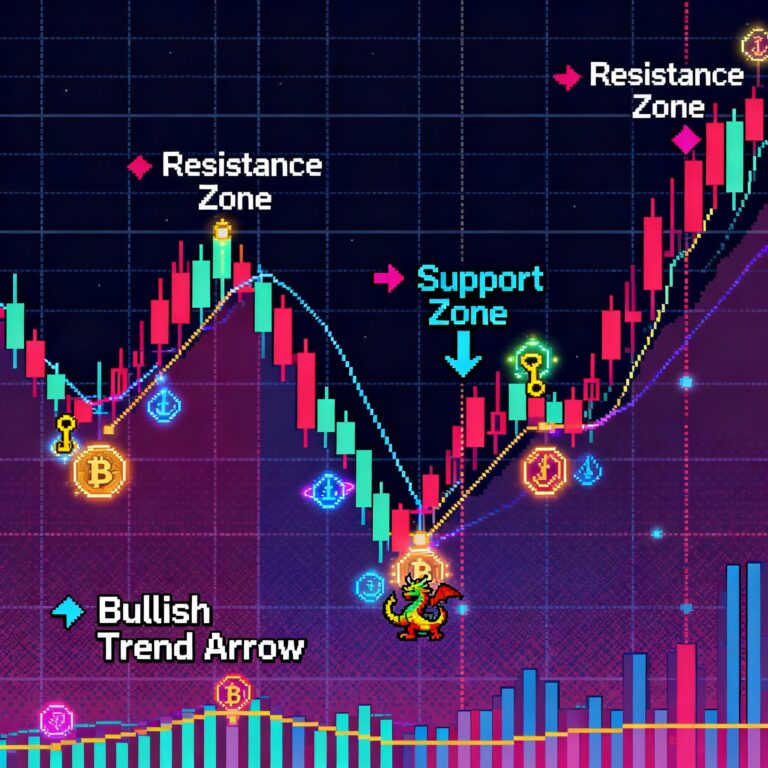
Comparing to yesterday, today's session confirms expectations: as forecast, clearing resistance zones near 4,500 has triggered additional buying interest, and the market structure remains well-supported. Predictions of strong uptrend persistence have materialized, with no technical evidence of lasting exhaustion. Looking ahead, the floor for ETH sits above 4,100 across all timeframes, while 4,500–4,600 acts as new support if broken. Should this bullish confluence hold, targets in the 4,800 to 5,000 region are within reach over the coming days. If price stalls at current resistance, the risk scenario would be a controlled pullback or brief consolidation. Overall, the call is long, as both trend and momentum clearly guide the market higher.

BTC: October 2, 2025 – Post Analysis

BTC: October 2, 2025 – Post Analysis

The weekly chart shows continued structural health, as BTC price has not challenged the fastest weekly DEMA. The only modest caution is a slightly negative MACD histogram and flattening ADX, signaling trend moderation. However, SRSI and DMI are recovering while CMF holds above zero, suggesting that after a brief pause or grind, BTC remains positioned for a reach toward the ambitious 122,000 area in coming weeks, as both cross-timeframe technicals and multi-week trend behavior point in that direction

AAVE Analysis: Momentum, Resistance, and the Path Forward

AAVE Analysis: Momentum, Resistance, and the Path Forward

Comparing today and yesterday, it is clear we avoided major selling, found support, and are now at a critical junction. The near-term strategy remains ‘cautious long’ – selective entries near support, with clear stop-losses below key DMAs. Aggressive long positions should be reserved for confirmed breaks above resistance. Both analyses foresee a likely period of sideways accumulation before the next breakout, and agree that only clear rejection or breakdown below 277 would call for a reversal toward shorting.

Navigating the Crossroads of Trend and Turbulence.

Navigating the Crossroads of Trend and Turbulence

Looking ahead, the forecast remains cautiously optimistic but hinges entirely on the pivotal $214 price level. The weekly chart continues to provide a strong bullish tailwind, with a positive MACD, DMI, and the price holding firmly above key moving averages. This indicates that the foundational structure for a continued bull run is intact.

Ethereum’s Path Forward: A High-Stakes Balancing Act

Ethereum's Path Forward: A High-Stakes Balancing Act

Zooming out, the weekly chart offers a beacon of hope for long-term holders, as its macro-bullish structure remains intact. This suggests the current market turmoil is a corrective phase within a larger, healthy uptrend. The ultimate question now is whether this is the moment the macro trend reasserts its dominance, or if the market requires one final capitulation before a durable bottom is finally forged and the next major leg up can begin.

Bitcoin’s Crossroads: A Tug-of-War Between Bulls and Bears

Bitcoin's Crossroads: A Tug-of-War Between Bulls and Bears

The critical resistance zone between $112,500 and $113,560 is unlikely to give way without a significant surge in buying pressure, which currently seems absent. Therefore, the most probable outcome is a period of defensive, sideways trading within this well-defined range as the market consolidates and awaits a decisive catalyst.

AAVE at a Technical Crossroads: Consolidation Reigns as Bulls Fail to Break Key Resistance

AAVE at a Technical Crossroads: Consolidation Reigns as Bulls Fail to Break Key Resistance

Looking ahead, the most probable path for AAVE is continued consolidation within the well-defined range between the $260 support floor and the $285 resistance ceiling. This sideways grind is not just random noise; it is a necessary phase of price discovery. This period allows the market to digest recent losses and lets the lagging moving averages on the daily and weekly charts converge closer to the price, which is often a prerequisite for the start of a new, powerful trend.

Solana’s Correction Eyes a Reflexive Bounce Within a Weekly Uptrend

Solana’s Correction Eyes a Reflexive Bounce Within a Weekly Uptrend

Based on the analysis, the key zone to watch for this bounce to materialize is between $210 and $214. A successful defense of this level could propel the price toward the next significant resistance at $220, a break of which would lend strong confirmation to the corrective bounce theory. Given Solana’s history of high-velocity moves, any such turn could be rapid.

Ethereum’s Bearish Tide and the Glimmer of a Bounce

Ethereum's Bearish Tide and the Glimmer of a Bounce

Based on historical price behavior, a strong bounce from the $3,900 support region remains a distinct possibility. The immediate strategy is to remain cautious, respecting the current downtrend by trailing stop-losses on any short positions, while staying vigilant for a confirmed, volume-supported bounce from this critical support zone that could signal the end of the current correction.