










Tag Solana market analysis

SOLANA  CRASH TO CAPITULATION LOWS – NOVEMBER 21, 2025 TECHNICAL POST
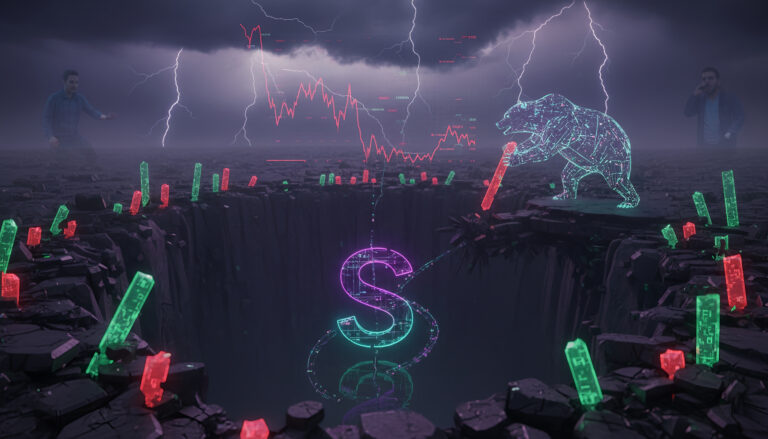
A neon Solana logo plunges into a deep pit surrounded by shattered red and green candlestick bars. A digital bear pushes a candle off the cliff; lightning crackles above, and ghostly traders watch the crash amid a stormy financial landscape.

Solana has plunged to $126.40, marking a devastating -$13.60 (-9.7%) decline over just two trading days and testing critical capitulation levels last seen during November's severest correction phases. Today's technical picture presents an extreme bearish domination across all timeframes—with 29 of 30 indicator readings confirmed bearish—yet paradoxically, extreme oversold conditions (SRSI K at 0.00 on both 2H and weekly charts) historically coincide with capitulation bottoms and potential bounce setup.


Solana’s Critical Test: When Bear Traps Meet Weekly Breakdown 2025 11 13

A weathered lighthouse shaped like the Solana logo stands on a rocky shore, battered by crashing storm waves under a dark, swirling sky with the glowing Solana symbol and lightning above

Yesterday's analysis predicted sideways consolidation for 48 hours within a sustained downtrend. Today confirms that narrative: price is stalling exactly where predicted, oscillators are topping, and resistance is manifesting precisely at the MA levels flagged. What we're watching for now is the reversal of this bounce. The coming 24-48 hours will likely see another test of $147-$150 support, potentially followed by breakdown toward $140 if the macro bearish cycle maintains its grip. Every technical signal suggests this bounce is a gift for short entry, not a reversal.

Solana’s Resilience Under Pressure: Bounce Exhaustion Signals Next Bear Cycle Acceleration 2025 11 07

A cracked Solana coin hovers over a jagged cliff ledge beneath stormy red-and-black clouds shaped like serpents, with blue price charts cascading downward and a shadowy bear lurking below, symbolizing market pressure and failing support.

Yesterday's analysis predicted sideways consolidation for 48 hours within a sustained downtrend. Today confirms that narrative: price is stalling exactly where predicted, oscillators are topping, and resistance is manifesting precisely at the MA levels flagged. What we're watching for now is the reversal of this bounce. The coming 24-48 hours will likely see another test of $147-$150 support, potentially followed by breakdown toward $140 if the macro bearish cycle maintains its grip. Every technical signal suggests this bounce is a gift for short entry, not a reversal.

Solana Holds Critical Support as Markets Test Resolve 20251023

A golden digital phoenix rises from turbulent ocean waves under a night sky filled with blockchain constellations, representing Solana’s network and growth, surrounded by glowing market charts and lights of the aurora borealis.

Moving forward, we anticipate Solana will likely consolidate between 185 and 193 dollars over the next twenty-four hours as the market digests recent volatility. A sustained move above 199 dollars would confirm trend reversal, while a breakdown below 186 opens the door to testing the 179 to 180 support zone we highlighted as a more attractive accumulation area for patient long-term positioning.