

BTC: October 2, 2025 – Post Analysis
Momentum on BTC remains undeniably bullish across all timeframes. Yesterday’s uncertainty around overbought signals quickly transitioned into a strong rally, pushing prices ahead of all fastest DEMAs in every intraday timeframe. While intraday indicators such as MACD, SRSI, RSI, and DMI are still showing overextended bullish readings, price action is running well ahead of mean levels, which almost always precedes shallow consolidation toward the 116,000–117,000 support zone. The four-hour and six-hour DEMAs remain materially lower than the current price, supporting predictions that any cooling will be met with strong demand at these consolidation levels. On the daily chart, both MACD and volume-backed CMF suggest the uptrend is maturing—not exhausted—and the RSI is already in bullish territory, supporting the case for sustained moves rather than reversal.
The weekly chart shows continued structural health, as BTC price has not challenged the fastest weekly DEMA. The only modest caution is a slightly negative MACD histogram and flattening ADX, signaling trend moderation. However, SRSI and DMI are recovering while CMF holds above zero, suggesting that after a brief pause or grind, BTC remains positioned for a reach toward the ambitious 122,000 area in coming weeks, as both cross-timeframe technicals and multi-week trend behavior point in that direction.
Yesterday’s outlook projected upside and flagged risks of overbought readings—today, the charts validate those risks but show no clear sign of bullish exhaustion or bull trap. The market continues to reward long bias, particularly when entering on consolidation dips near the rapid DEMA levels observed in all active timeframes. If bullish breadth holds, BTC remains poised to extend, with local pullbacks representing opportunity rather than threat.
#BTC #Bitcoin #TradingAnalysis #CryptoSignals #DEMA #TechnicalAnalysis
BTC/USDT Perpetual (Bybit)
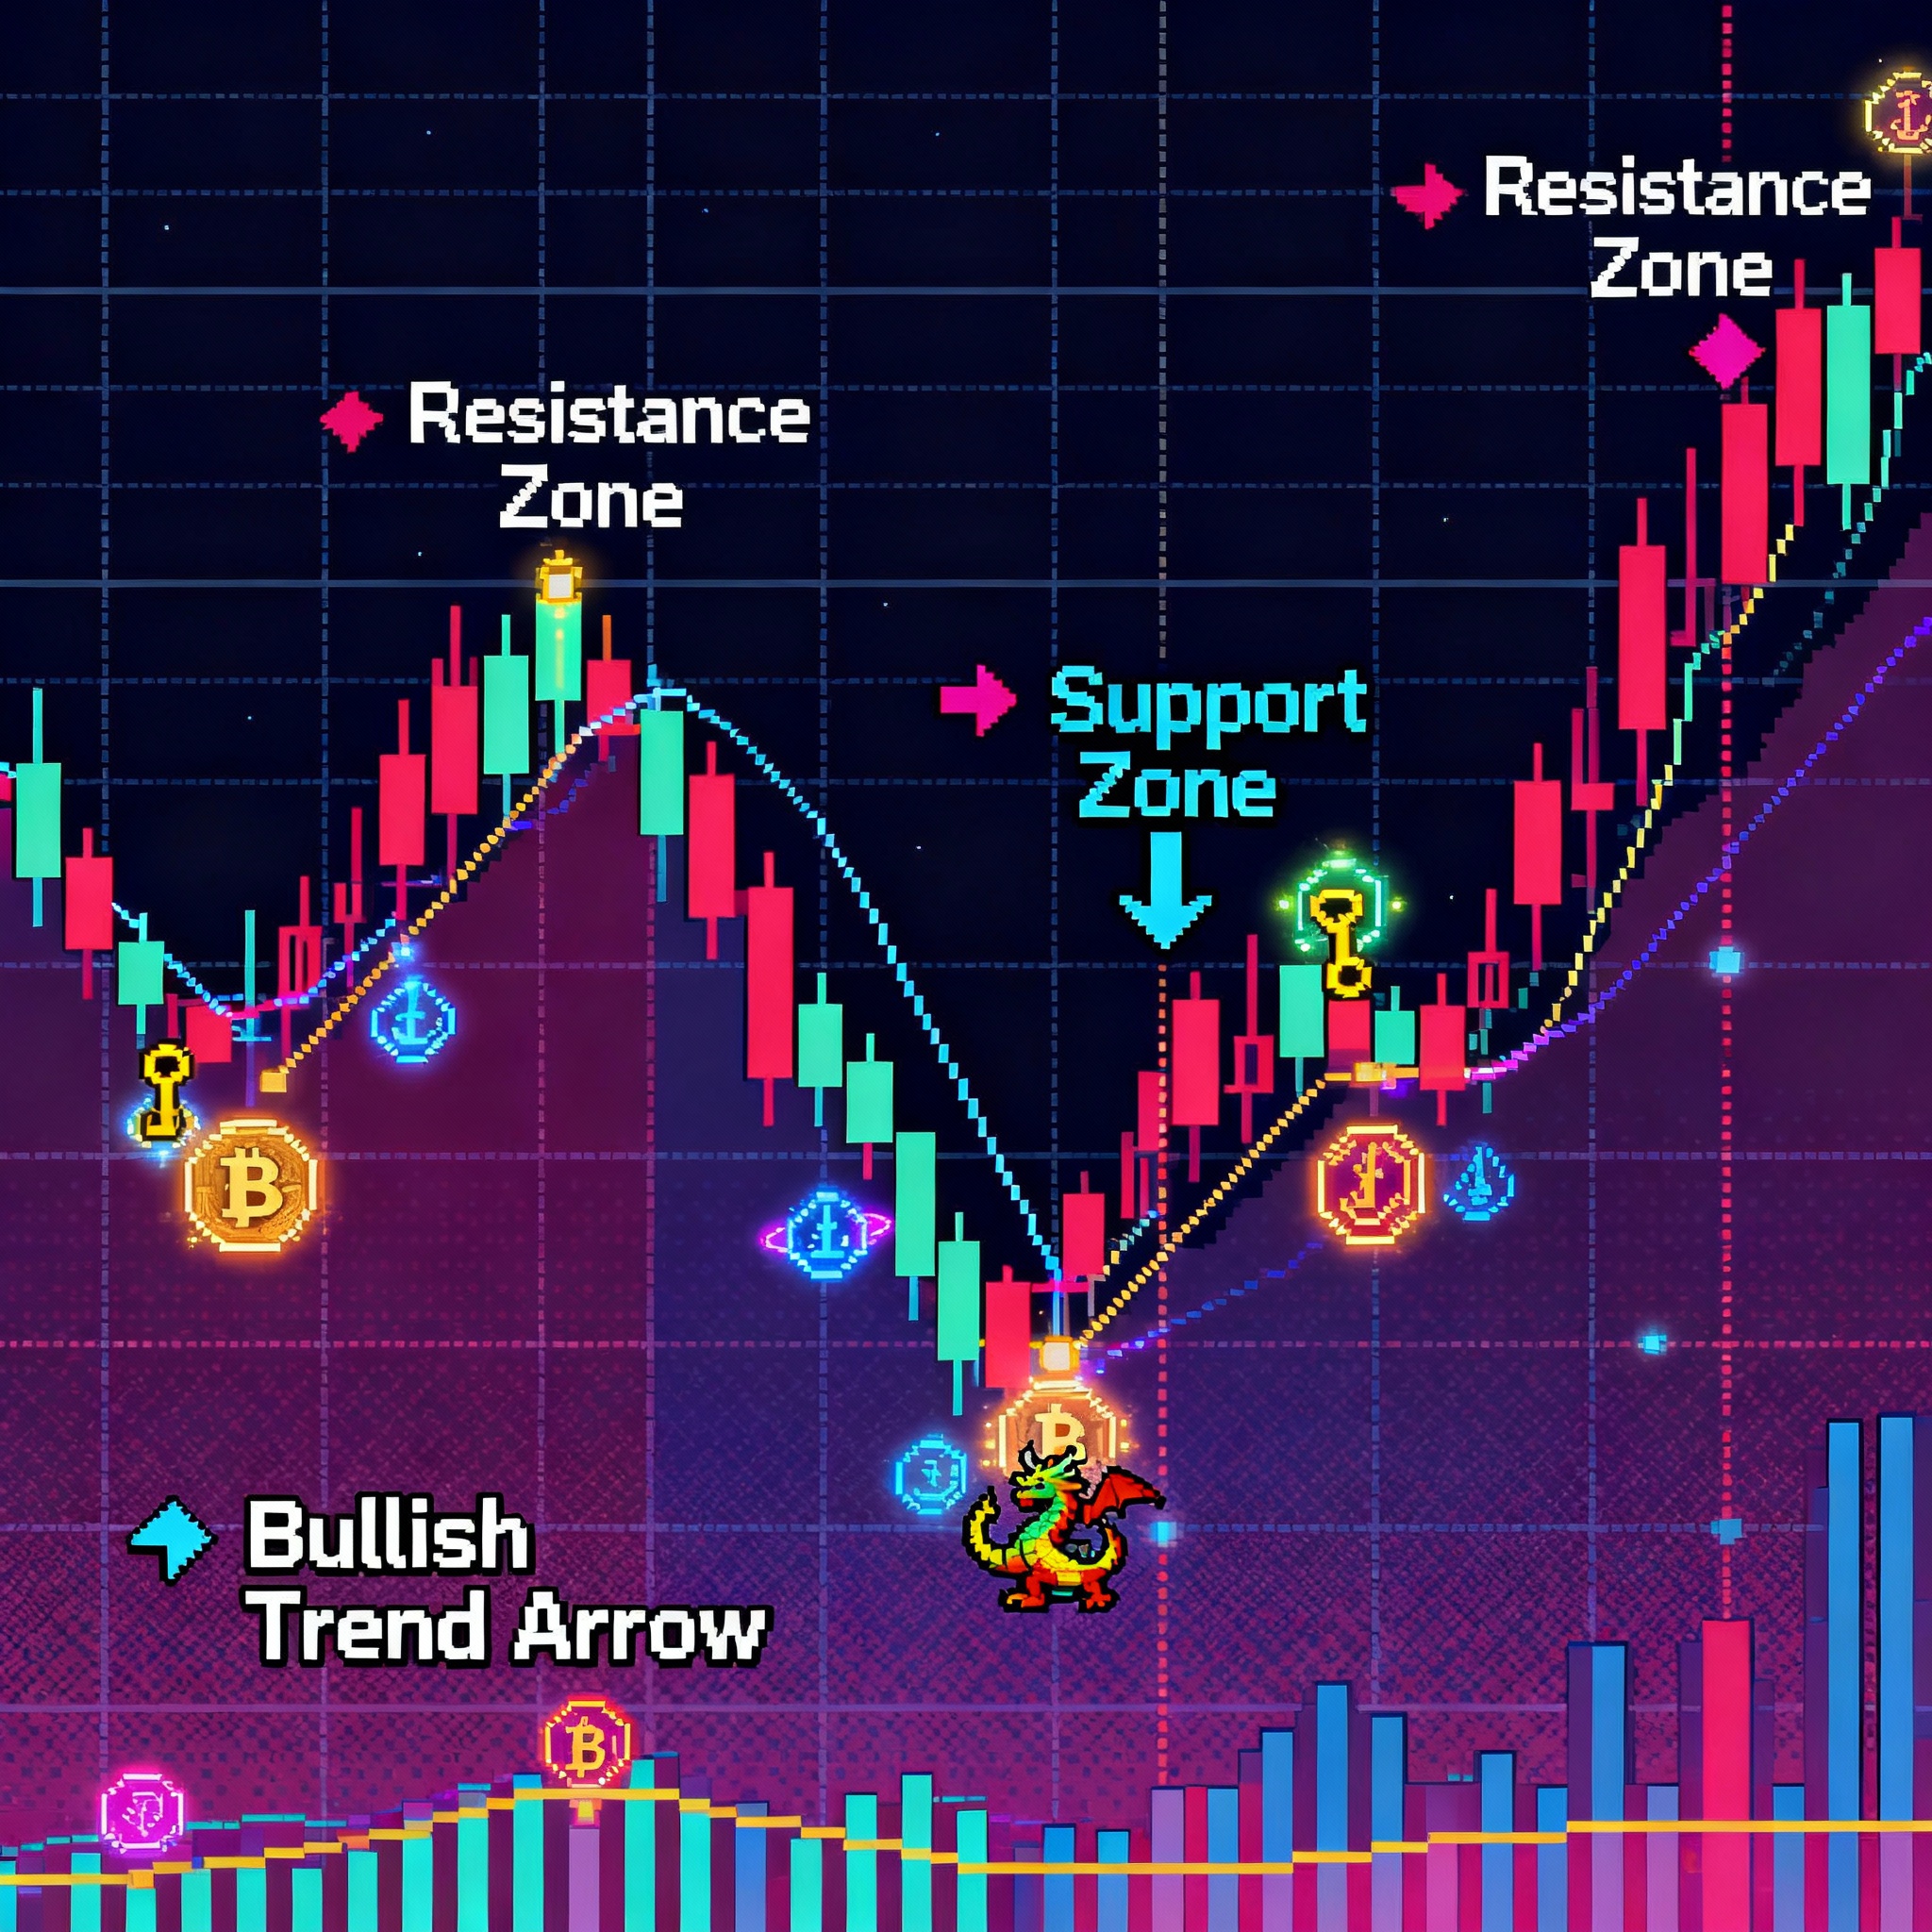
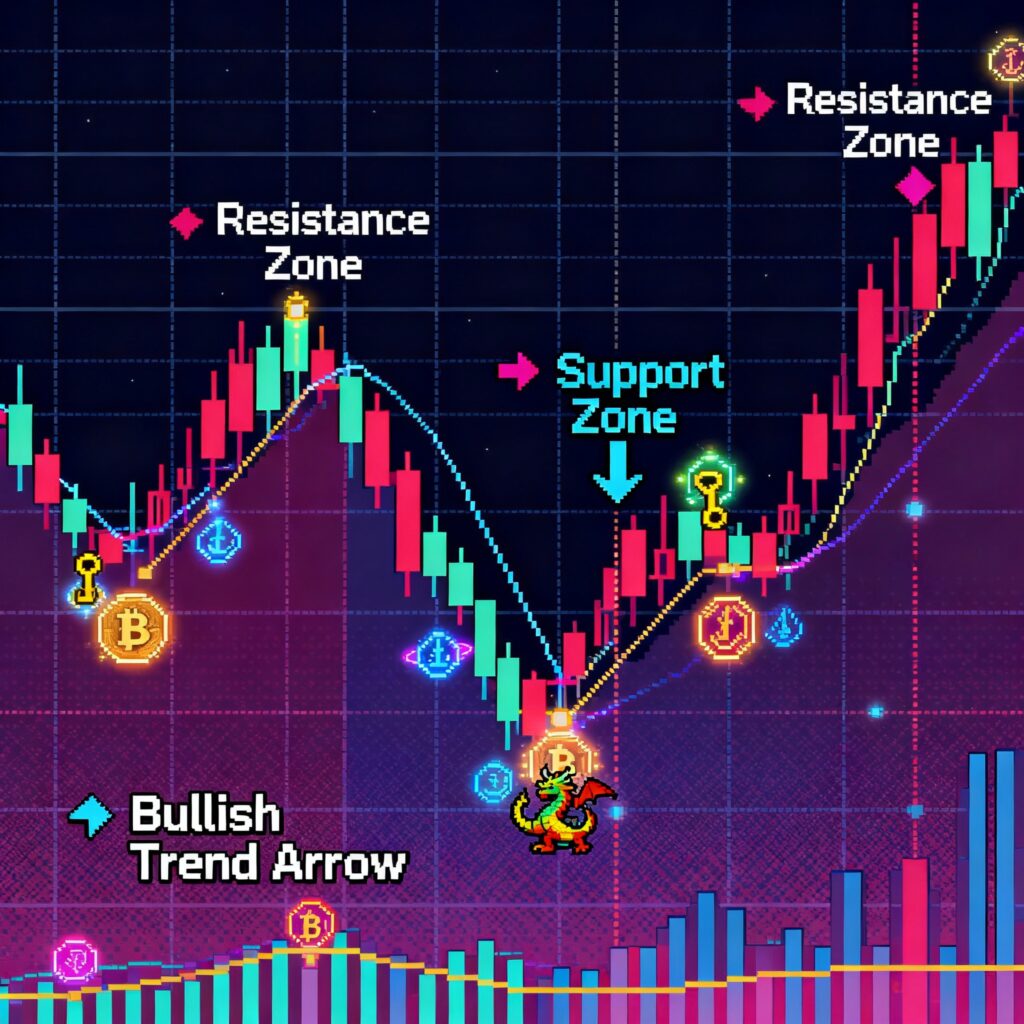
Technical Analysis for BTC/USDT.P
Advanced Chart for BTC/USDT.P
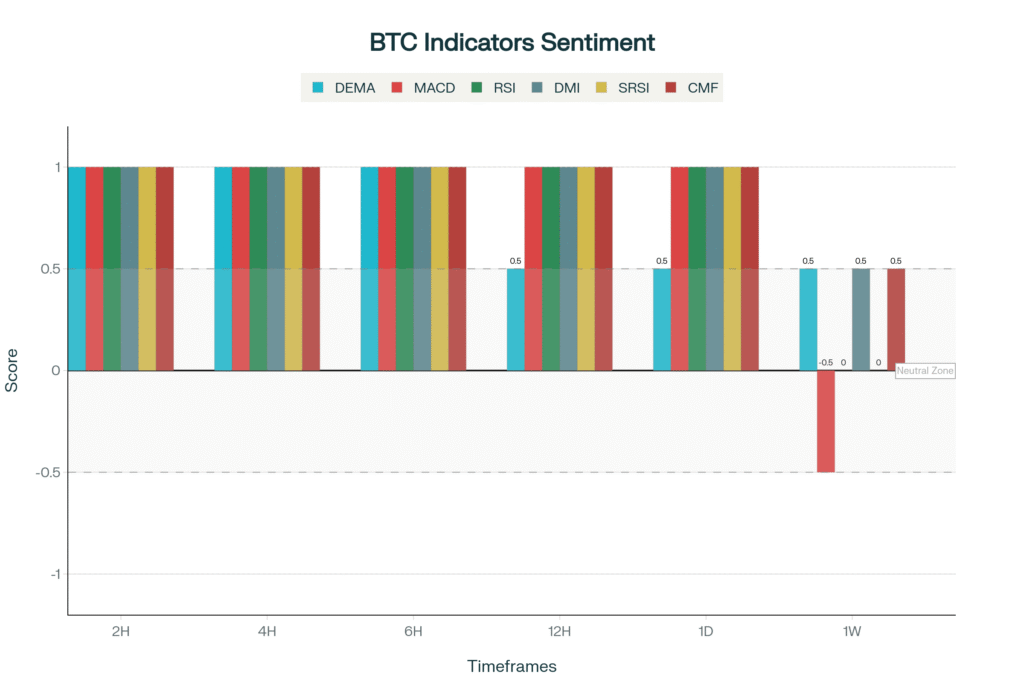
This chart visually represents the consensus indicator scores across all analyzed timeframes, providing a clear, at-a-glance view of the prevailing market sentiment.
-1 = Bearish 🧸 ,+1=Bullish 🐂 ,+-0.5 weak Bullish/Bearish , 0(0.5-0.5) = Neutral
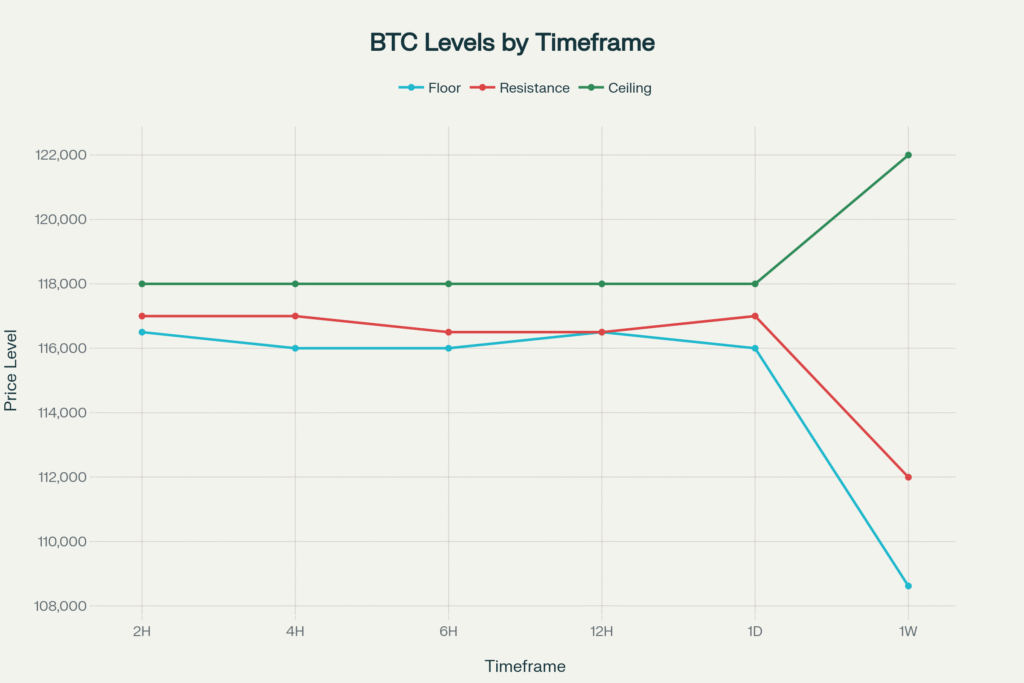
This chart plots the key price levels—floor, resistance, and ceiling—that we identified for each timeframe. It helps in visualizing the critical support and resistance zones.
Disclaimer
The content in this publication is for informational and educational purposes only and does not constitute financial, investment, or trading advice. I am not a licensed financial advisor.
Any opinions, strategies, or analyses shared reflect my personal views and experiences. I may hold positions in the cryptocurrencies mentioned (e.g., BTC, ETH, SOL), which could influence my perspective.
Cryptocurrency markets are highly volatile and involve significant risk. Always do your own research and consult a licensed financial advisor before making any investment decisions.
No guarantees are made regarding the accuracy, completeness, or profitability of any information provided. All opinions are subject to change as new information becomes available.
This content is intended for a general audience and may not comply with regulatory standards in your specific country or region. Invest responsibly.
