

Bitcoin Reaches Critical Pivoting Point at $115K: Will the Bulls Reclaim Control? (20251013PM)
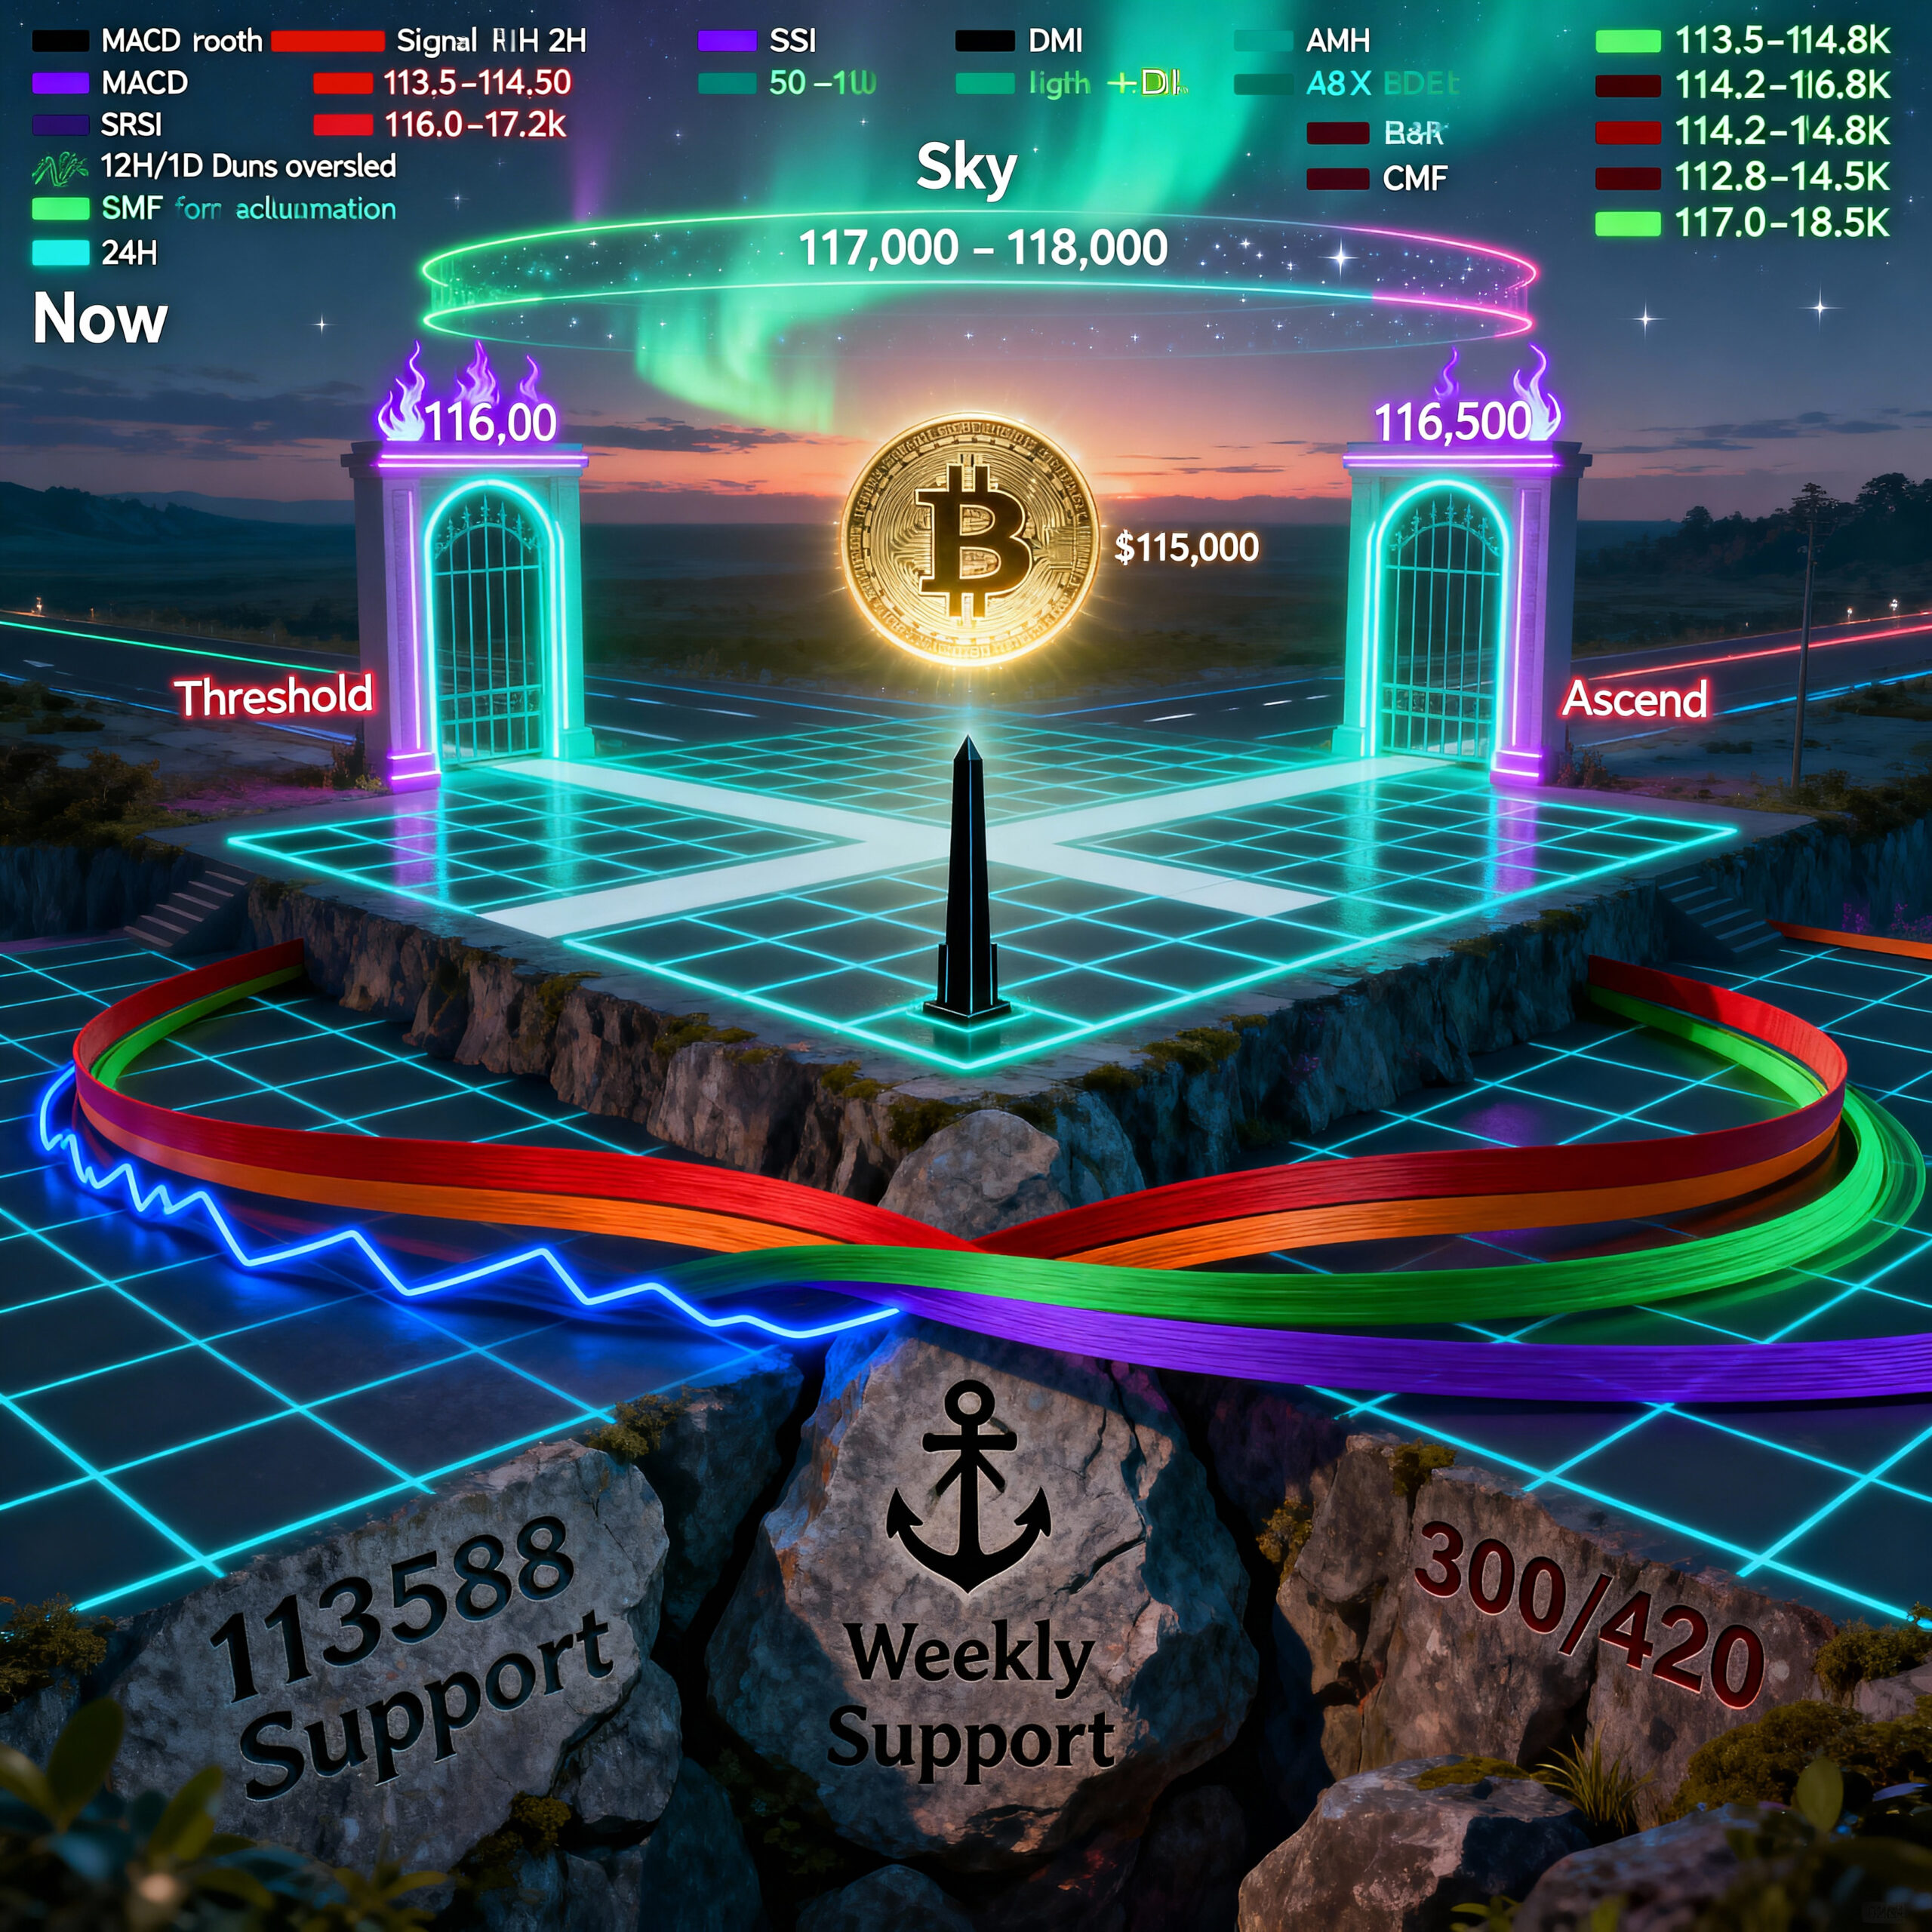
Bitcoin closed yesterday hovering around the $115,000 mark after experiencing significant volatility throughout the week. Our previous analysis called for caution in the mid-$117,000 range, and markets obliged with a swift correction that tested support levels near $113,000. Today, we’re seeing early signs of stabilization as BTC attempts to find its footing at this crucial technical junction.
The current market structure reveals a fascinating contradiction. On higher timeframes, Bitcoin’s weekly chart maintains its bullish posture with price holding firmly above the key DEMA support at $113,588. The weekly MACD remains elevated in positive territory, and directional momentum indicators show buying pressure still outweighing selling pressure. This foundational strength suggests the broader uptrend remains intact despite recent weakness.
However, lower timeframes paint a more cautious picture. The six-hour chart displays a powerful bearish trend with an ADX reading of 49.04, indicating strong directional momentum that hasn’t yet exhausted itself. Meanwhile, shorter two-hour and four-hour charts show extreme overbought conditions on stochastic indicators, with readings hitting maximum levels of 100. These extremes typically precede consolidation or correction phases rather than immediate continuation.
The technical setup creates an interesting risk-reward scenario. Multiple timeframes show deeply oversold RSI readings, suggesting a bounce could materialize quickly. Positive money flow readings across most timeframes indicate smart money accumulation occurring beneath current prices. Yet the $116,000 level looms as the make-or-break resistance zone that must be conquered for bulls to regain control.
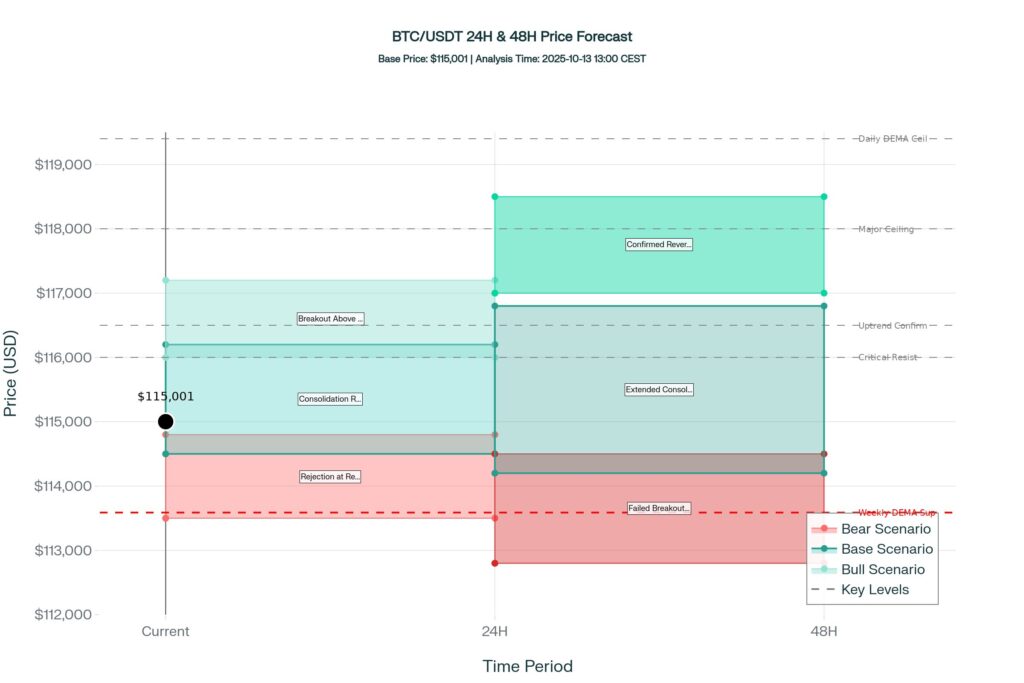
Looking ahead, we anticipate continued consolidation through the next 24 to 48 hours. A sustained break above $116,500 would confirm trend reversal and open pathways toward $117,000 to $118,000 targets. Conversely, failure to reclaim this level risks retesting support near $113,000. Traders should exercise patience and wait for clear confirmation before committing to directional positions at this pivotal moment in Bitcoin’s price discovery.
#Bitcoin #BTC #CryptoAnalysis #TechnicalAnalysis #Trading #Cryptocurrency
BTC/USDT Perpetual (Bybit)
Technical Analysis for BTC/USDT.P
Advanced Chart for BTC/USDT.P
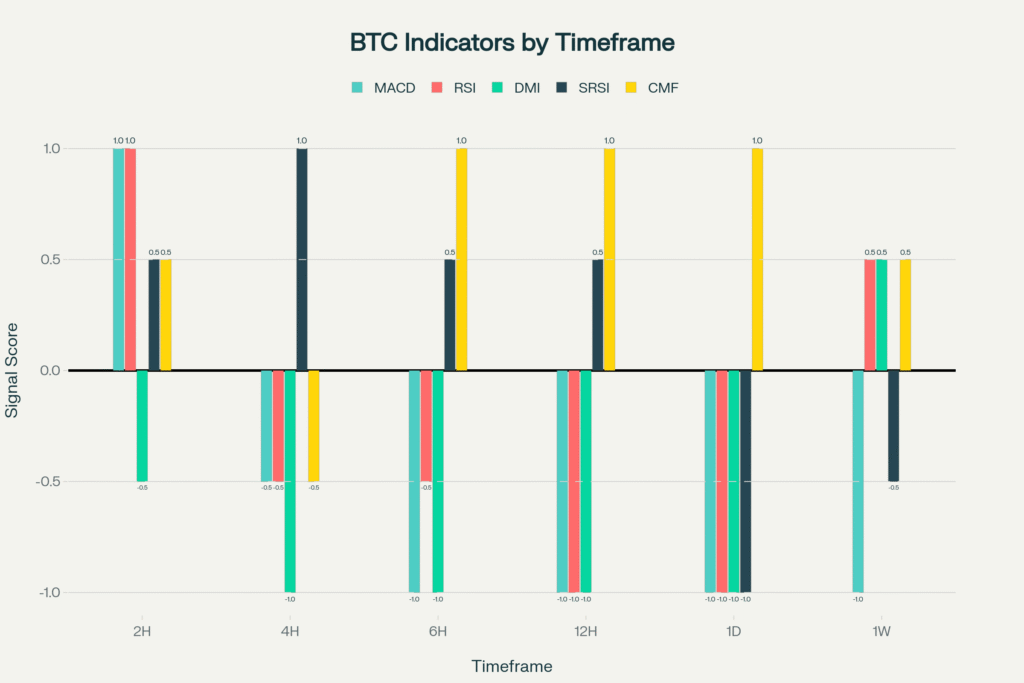
This chart visually represents the consensus indicator scores across all analyzed timeframes, providing a clear, at-a-glance view of the prevailing market sentiment.
-1 = Bearish 🧸 ,+1=Bullish 🐂 ,+-0.5 weak Bullish/Bearish , 0(0.5-0.5) = Neutral
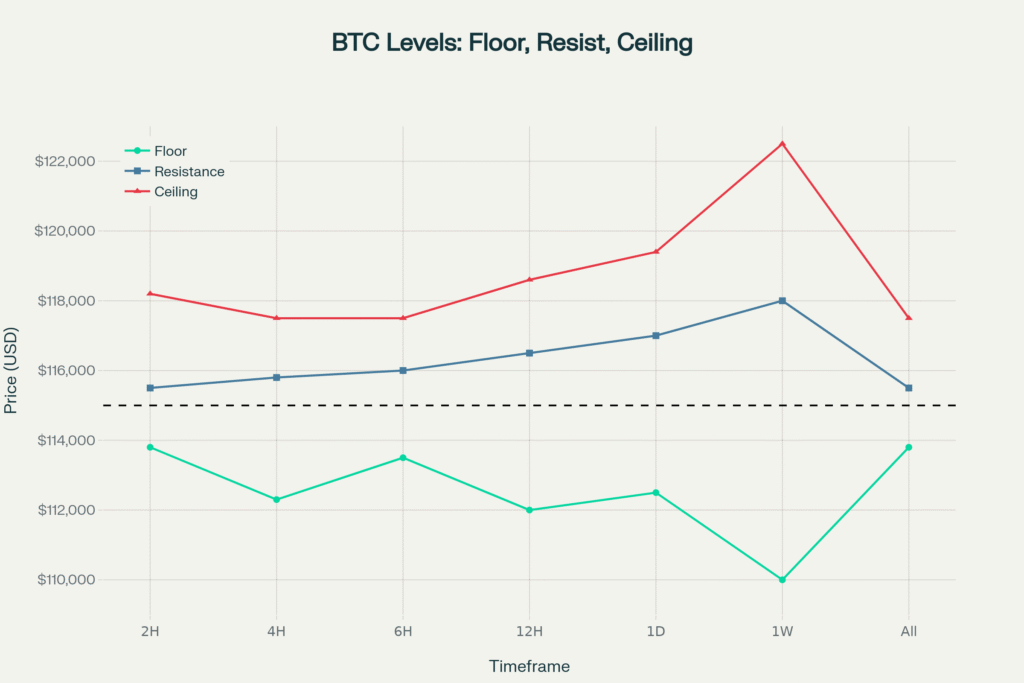
This chart plots the key price levels—floor, resistance, and ceiling—that we identified for each timeframe. It helps in visualizing the critical support and resistance zones.
Disclaimer
The content in this publication is for informational and educational purposes only and does not constitute financial, investment, or trading advice. I am not a licensed financial advisor.
Any opinions, strategies, or analyses shared reflect my personal views and experiences. I may hold positions in the cryptocurrencies mentioned (e.g., BTC, ETH, SOL), which could influence my perspective.
Cryptocurrency markets are highly volatile and involve significant risk. Always do your own research and consult a licensed financial advisor before making any investment decisions.
No guarantees are made regarding the accuracy, completeness, or profitability of any information provided. All opinions are subject to change as new information becomes available.
This content is intended for a general audience and may not comply with regulatory standards in your specific country or region. Invest responsibly.
