US and Israels strategy to kill Irans top figures may prove counterproductive
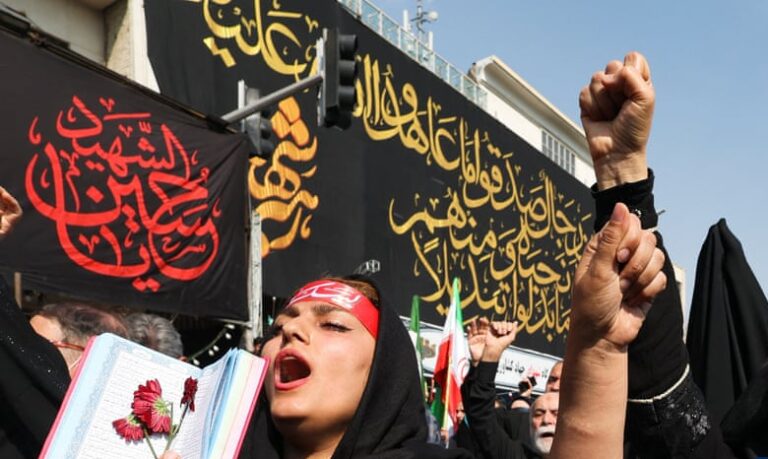
Israel’s decision to authorise its military to kill any senior Iranian official on its assassination list has raised significant new questions about its so-called decapitation strategy and what it is intended to achieve. Privately, Israeli officials have briefed their US…