

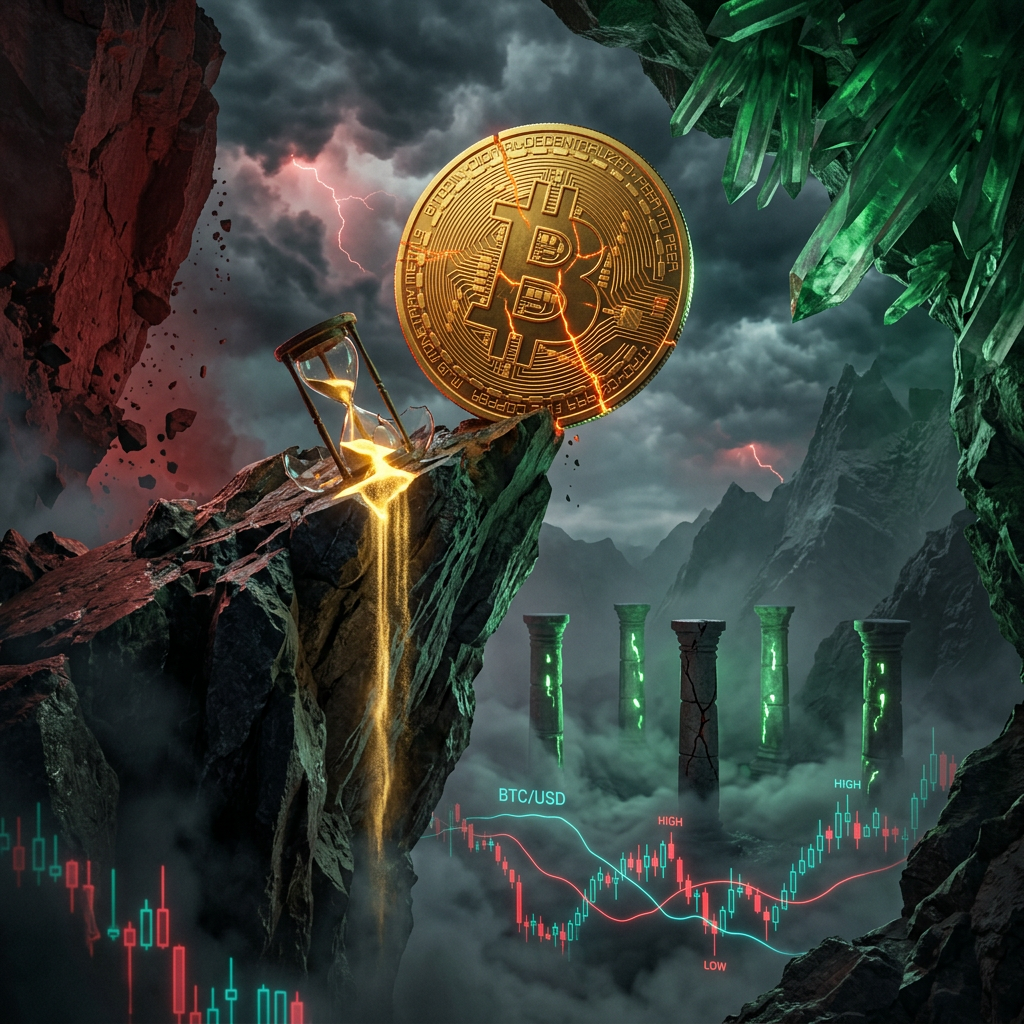
Bitcoin’s Bullish Cycle Shows Cracks as 82k Resistance Proves Formidable 2026 05 13
Bitcoin sits at $80,978 this morning, and if you’ve been tracking our analysis over the past few days, you’ll notice a distinct shift in the character of this market. Where we previously saw a healthy bullish advance, we’re now observing the unmistakable signs of cycle exhaustion across multiple timeframes — a theme that demands our full attention.
Looking at the 2-hour chart, the moving averages are flattening and converging around price, a textbook signal that the current trend is losing steam. The MACD sits below zero, and while it remains above its signal line, both are deep in negative territory. More critically, the Stoch RSI on the 2-hour is flashing overbought with K and D both above 80, and the D-line now leading K downward — exhaustion written in technical ink. The CMF has turned negative, suggesting that smart money may be distributing into this weakness rather than accumulating.
The 4-hour and 12-hour charts tell a similar story. Moving averages that were once fanning out in bullish alignment are now converging, with the MACD slipping below its signal line and histograms turning faintly negative. On the 12-hour, we see the CMF entering distribution territory — a warning shot that the rally from 77k may be running on fumes.
Our analysis from yesterday identified the 77,000 to 82,000 range as the critical battlefield, and that assessment has proven accurate. Price has tested 82,000 multiple times and been rejected each time, confirming it as the ceiling. The 77,000 level, where the daily MA1 and MA2 converge, remains the floor. Until one of these levels gives way on a sustained basis, we’re in no-man’s land.
The weekly chart adds important context. The MACD is above its signal line with a positive histogram, but both remain below zero — indecisive. The weekly RSI sits just below 50, and the DMI shows -DI slightly above +DI. This is accumulation territory, not trending territory, which means the macro picture remains undecided even as shorter timeframes flash exhaustion warnings.
What does this mean for us? Patience. We’re not chasing entries here. If price breaks and sustains above 82,000 — ideally followed by a move through 83,500 — we’ll consider a small long position. If it fails and drops below 77,000, the bias shifts bearish. The 6-hour Stoch RSI is oversold and bouncing, which could provide a short-term lift, but without CMF confirmation across the 4-hour and 6-hour, any rally is suspect. We’re watching, we’re waiting, and we’re letting the market tell us which direction it wants to go before committing capital.
#BTC #BitcoinAnalysis #CryptoTrading #MarketExhaustion #TradingSignals #BTCUSDT
BTC/USDT Perpetual (Bybit)
Technical Analysis for BTC/USDT.P
Advanced Chart for BTC/USDT.P
This chart visually represents the consensus indicator scores across all analyzed timeframes, providing a clear, at-a-glance view of the prevailing market sentiment.
-1 = Bearish 🧸 ,+1=Bullish 🐂 ,+-0.5 weak Bullish/Bearish , 0(0.5-0.5) = Neutral
This chart plots the key price levels—floor, resistance, and ceiling—that we identified for each timeframe. It helps in visualizing the critical support and resistance zones.
Disclaimer
The content in this publication is for informational and educational purposes only and does not constitute financial, investment, or trading advice. I am not a licensed financial advisor.
Any opinions, strategies, or analyses shared reflect my personal views and experiences. I may hold positions in the cryptocurrencies mentioned (e.g., BTC, ETH, SOL), which could influence my perspective.
Cryptocurrency markets are highly volatile and involve significant risk. Always do your own research and consult a licensed financial advisor before making any investment decisions.
No guarantees are made regarding the accuracy, completeness, or profitability of any information provided. All opinions are subject to change as new information becomes available.
This content is intended for a general audience and may not comply with regulatory standards in your specific country or region. Invest responsibly.
AI Disclosure: This post was created with the assistance of artificial intelligence. The ideas, analysis, and opinions expressed are my own — AI was used to help compose, structure, and refine my personal notes and thoughts into the final written content. Images, videos and music featured in this post were also generated using AI tools, based on my own creative prompts and direction.
