


Double click on the video for full screen!!
Solana Tests the Mid-Range While the Macro Bear Structure Still Calls the Shots – 2026 01 05
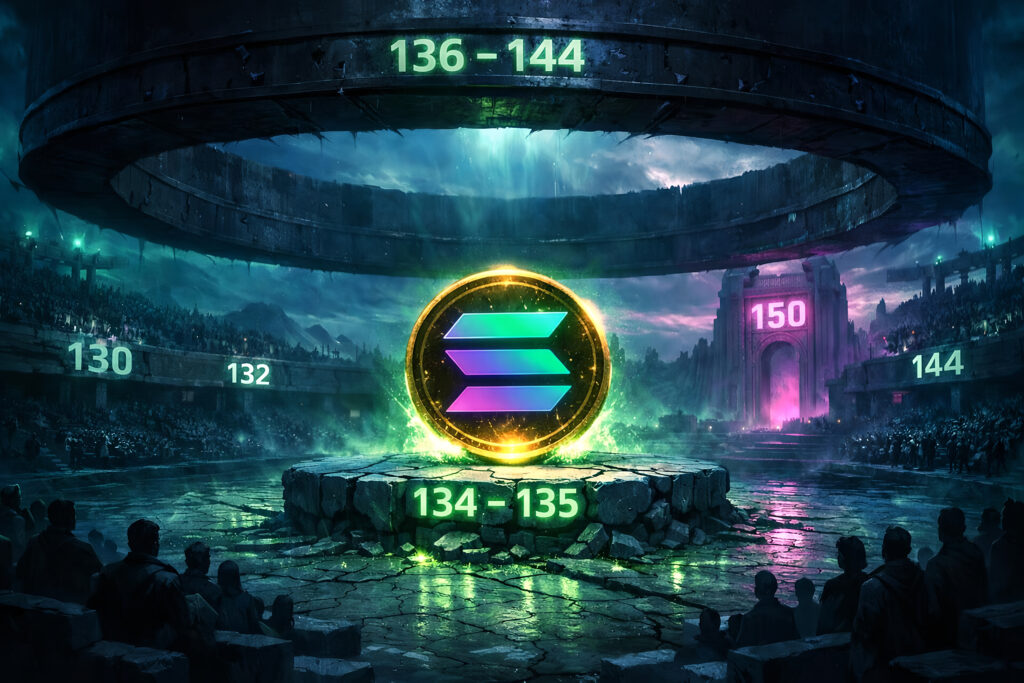
Solana is trading around 135.05 today, doing exactly what a structurally bearish market with short-term relief energy tends to do: hovering in the middle of its own battlefield. Our multi‑timeframe FLORECEI levels put the unified floor All-Floor at 134.63 and the first cross‑frame resistance All-Resistance at 136.30, with a tactical ceiling cluster around 144.50. Price is sitting just above that aggregated floor and just below the first real overhead test, which is exactly where indecision and fake comfort live for traders who forget the larger structure.
Compared with our earlier SOL work, where we repeatedly highlighted 130–132 as the structural support band and 136–144 as the tactical sell zone, todays price action simply confirms that the market has walked straight into the range we mapped out. The bounce from lower levels has reached the mid‑130s, but nothing in the level architecture says “reversal” yet; it says “decision pending.”
Our new 24H–48H prediction graph reinforces that message in numbers instead of adjectives. For the next 24 hours, our base case carries 60 probability for a consolidation band between 132 and 138, essentially letting price oscillate around the All-Floor while testing, but not yet breaking, the 136.5 resistance line. The bear path, at 20 probability, pushes a deeper probe into 129–132, retesting the support window we have treated as critical for weeks. The bull scenario also holds 20, but even there upside is framed as an extension into 138–144, directly into the 136.5–144.5 resistance corridor, not a clean escape from it. Out at 48 hours, we still anchor the base case in a wide 130–140 range with 55 weight, a classic “range hold” profile when structure dominates and catalysts are missing. Only 15 is assigned to a sharper breakdown toward 124–130, and 30 to a more optimistic drift toward 140–148 that would lean into the macro barrier at 150 without yet invalidating the broader bearish map.
What this means for us, and for any SOL trader reading this, is that discipline has to beat emotion. Our analysis says the path of least resistance is still sideways‑to‑down inside a bearish framework. Dips toward 130–132 are tests of structure, not automatic “buy the bottom forever” signals. Pushes into 136–144 are opportunities to measure exhaustion, not confirmation that the downtrend has died. Until price can sustain closes above the 144.5 band and start attacking the 150 macro barrier with real volume, we treat every bounce as a tactical event, not a structural change. In practice, that means planning entries and exits around the levels the FLORECEI and forecast charts give us, not around hope. Respect 130 as the line where the floor must hold, and respect 136–144 as the zone where the market will decide who is really in control for the rest of this month.
Solana #SOL #TechnicalAnalysis #CryptoTrading #ReversalSignals #TradingSetup
SOL/USDT Perpetual (Bybit)
Technical Analysis for SOL/USDT.P
Advanced Chart for SOL/USDT.P
This chart visually represents the consensus indicator scores across all analyzed timeframes, providing a clear, at-a-glance view of the prevailing market sentiment.
-1 = Bearish 🧸 ,+1=Bullish 🐂 ,+-0.5 weak Bullish/Bearish , 0(0.5-0.5) = Neutral
This chart plots the key price levels—floor, resistance, and ceiling—that we identified for each timeframe. It helps in visualizing the critical support and resistance zones.
Disclaimer
The content in this publication is for informational and educational purposes only and does not constitute financial, investment, or trading advice. I am not a licensed financial advisor.
Any opinions, strategies, or analyses shared reflect my personal views and experiences. I may hold positions in the cryptocurrencies mentioned (e.g., BTC, ETH, SOL), which could influence my perspective.
Cryptocurrency markets are highly volatile and involve significant risk. Always do your own research and consult a licensed financial advisor before making any investment decisions.
No guarantees are made regarding the accuracy, completeness, or profitability of any information provided. All opinions are subject to change as new information becomes available.
This content is intended for a general audience and may not comply with regulatory standards in your specific country or region. Invest responsibly.
