


Ethereum Shows Promising Reversal Signs After Challenging Weekend (20251310PM)
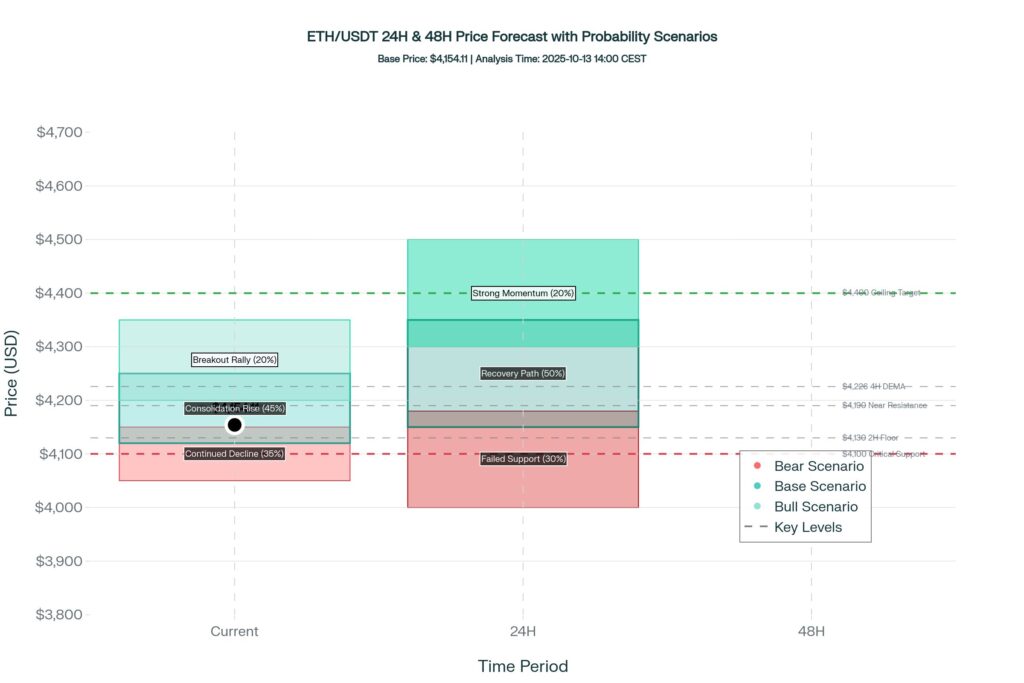
Ethereum traders watched nervously over the past few days as the second-largest cryptocurrency tested crucial support levels, but today’s technical picture suggests the worst may be behind us. After sliding from overhead resistance near forty-three hundred dollars, ETH found its footing around the forty-one hundred dollar zone, and what we’re witnessing now could mark the beginning of a meaningful bounce.
Yesterday’s assessment highlighted the bearish pressure across longer timeframes, with DEMA structures maintaining downward trajectories and momentum indicators firmly in negative territory. The concern was whether Ethereum could hold the psychologically important four thousand dollar level or if we’d see further deterioration toward the mid-thirty-nine hundreds. Looking at today’s action, the bulls have stepped up exactly where they needed to, with price breaking above the slowest DEMA on both twelve-hour and daily timeframes, a development that significantly alters the technical landscape.
What makes today’s setup particularly interesting is the divergence developing across multiple timeframes. While the longer-duration charts still display bearish structure, shorter timeframes are painting an increasingly bullish picture. The two-hour and four-hour charts show MACD indicators climbing decisively into positive territory, RSI readings pushing into overbought zones, and most importantly, the Directional Movement Index revealing that buying pressure is overwhelming selling pressure. The CMF readings across all timeframes remain consistently positive, suggesting smart money continues accumulating despite the recent weakness.
The critical level to watch moving forward is forty-two hundred dollars. Price needs to reclaim and hold this zone to confirm the reversal is genuine rather than just another bear market bounce. Support has solidified in the forty-one hundred to forty-one fifty range, creating a relatively tight risk zone for traders looking to position for the anticipated move higher. A failure to hold these levels would likely trigger a test of the four thousand dollar round number, but current momentum suggests the path of least resistance may finally be tilting upward. The weekly timeframe remains constructive, with DEMA structure still intact and RSI holding well above sixty, reminding us that despite recent choppiness, the broader uptrend hasn’t been violated. For traders who’ve been patient, the reward-to-risk ratio is starting to look attractive.
#Ethereum #ETH #CryptoAnalysis #TechnicalAnalysis #CryptoTrading #Cryptocurrency
ETH/USDT Perpetual (Bybit)
Technical Analysis for ETH/USDT.P
Advanced Chart for ETH/USDT.P
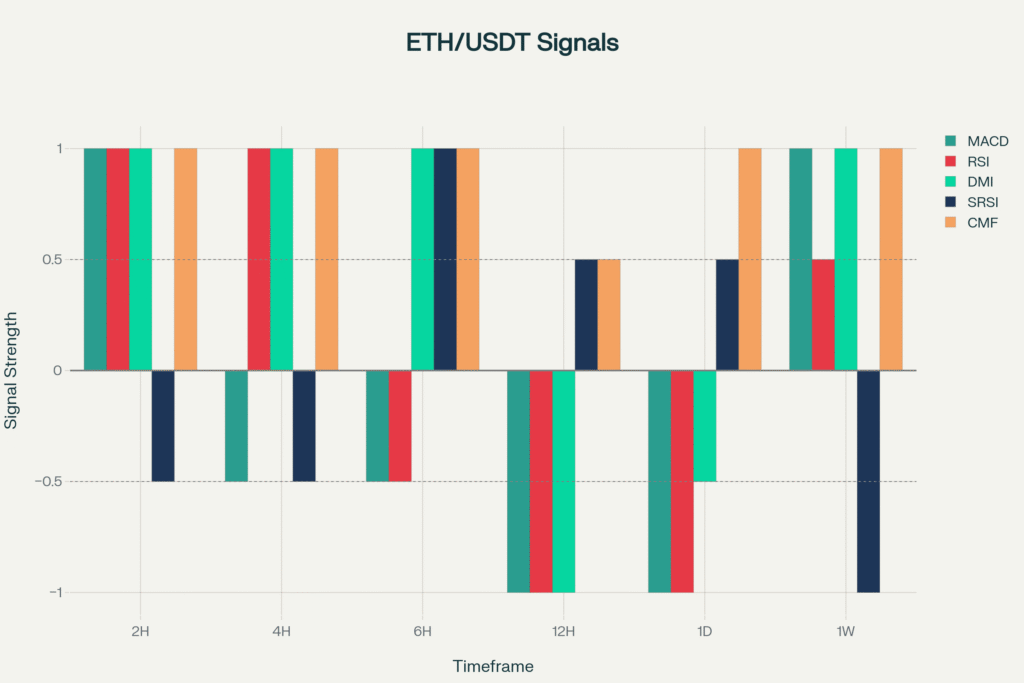
This chart visually represents the consensus indicator scores across all analyzed timeframes, providing a clear, at-a-glance view of the prevailing market sentiment.
-1 = Bearish 🧸 ,+1=Bullish 🐂 ,+-0.5 weak Bullish/Bearish , 0(0.5-0.5) = Neutral
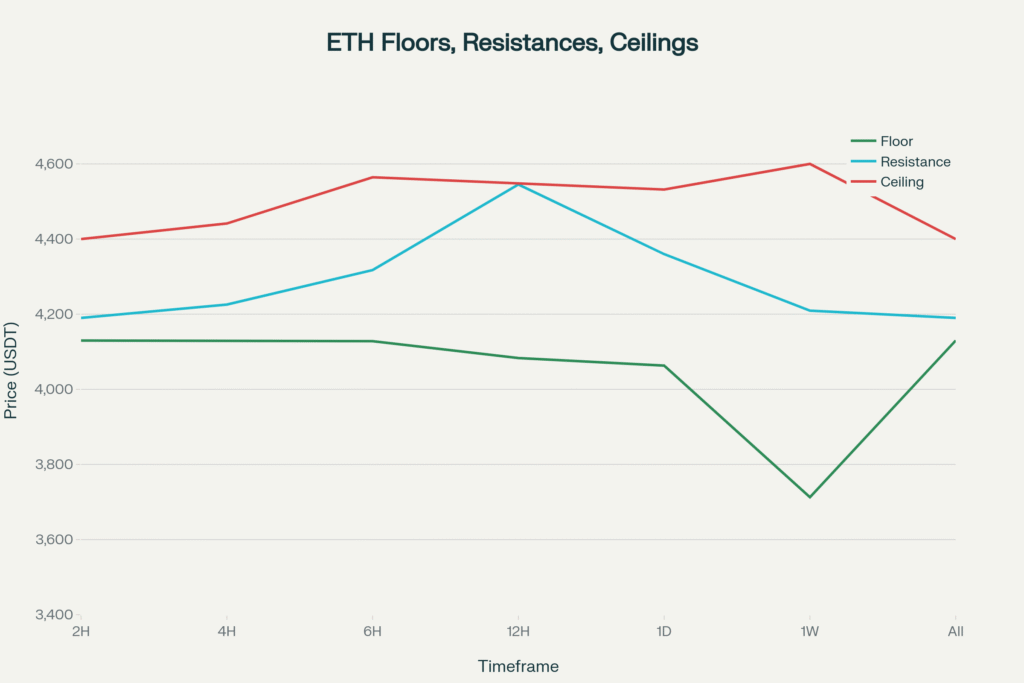
This chart plots the key price levels—floor, resistance, and ceiling—that we identified for each timeframe. It helps in visualizing the critical support and resistance zones.
Disclaimer
The content in this publication is for informational and educational purposes only and does not constitute financial, investment, or trading advice. I am not a licensed financial advisor.
Any opinions, strategies, or analyses shared reflect my personal views and experiences. I may hold positions in the cryptocurrencies mentioned (e.g., BTC, ETH, SOL), which could influence my perspective.
Cryptocurrency markets are highly volatile and involve significant risk. Always do your own research and consult a licensed financial advisor before making any investment decisions.
No guarantees are made regarding the accuracy, completeness, or profitability of any information provided. All opinions are subject to change as new information becomes available.
This content is intended for a general audience and may not comply with regulatory standards in your specific country or region. Invest responsibly.
