Tag Bitcoin market analysis

Bitcoin’s Calculated Correction Points to Bullish Revival.

BTC indicator signal scores chart showing MACD, RSI, DMI, SRSI, and CMF across six timeframes (2H, 4H, 6H, 12H, 1D, 1W) with values ranging from -1 (strong bearish) to +1 (strong bullish). Chart displays grouped bars color-coded by indicator revealing short-term bearish signals transitioning to longer-term bullish momentum.

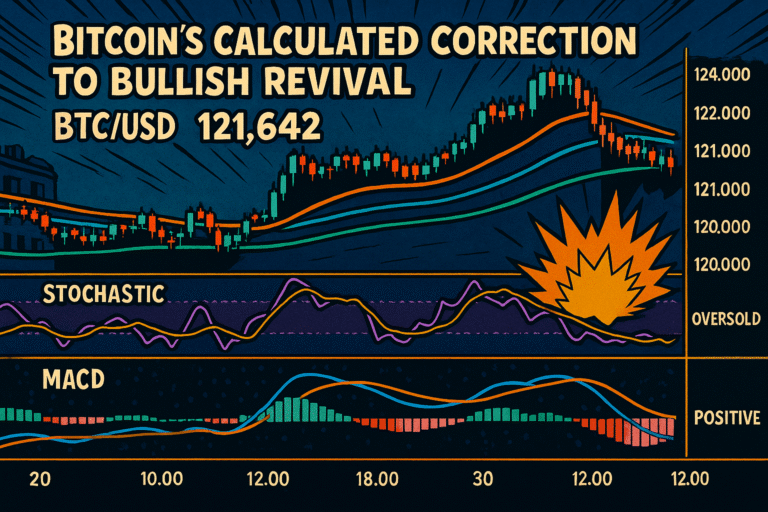
Looking ahead, Bitcoin appears positioned for renewed upward momentum once current oversold conditions resolve. Support holds firm between $120,000-$121,500, with resistance targets at $124,000-$125,000 coming into focus. The convergence of oversold shorter timeframes and bullish longer timeframes creates an attractive risk-reward setup favoring longs

Bitcoin’s Crossroads: A Tug-of-War Between Bulls and Bears

Bitcoin's Crossroads: A Tug-of-War Between Bulls and Bears

The critical resistance zone between $112,500 and $113,560 is unlikely to give way without a significant surge in buying pressure, which currently seems absent. Therefore, the most probable outcome is a period of defensive, sideways trading within this well-defined range as the market consolidates and awaits a decisive catalyst.

Bitcoin Technical Analysis Update: September 15, 2025

#BitcoinAnalysis #BTCUSDT #TechnicalAnalysis #CryptoTrading #MarketStructure #TradingStrategy

Bitcoin continues to demonstrate its characteristic volatility as market participants grapple with conflicting signals across multiple timeframes. Today’s analysis reveals a complex tapestry of momentum indicators suggesting neither bulls nor bears have established decisive control, though subtle shifts in underlying…