


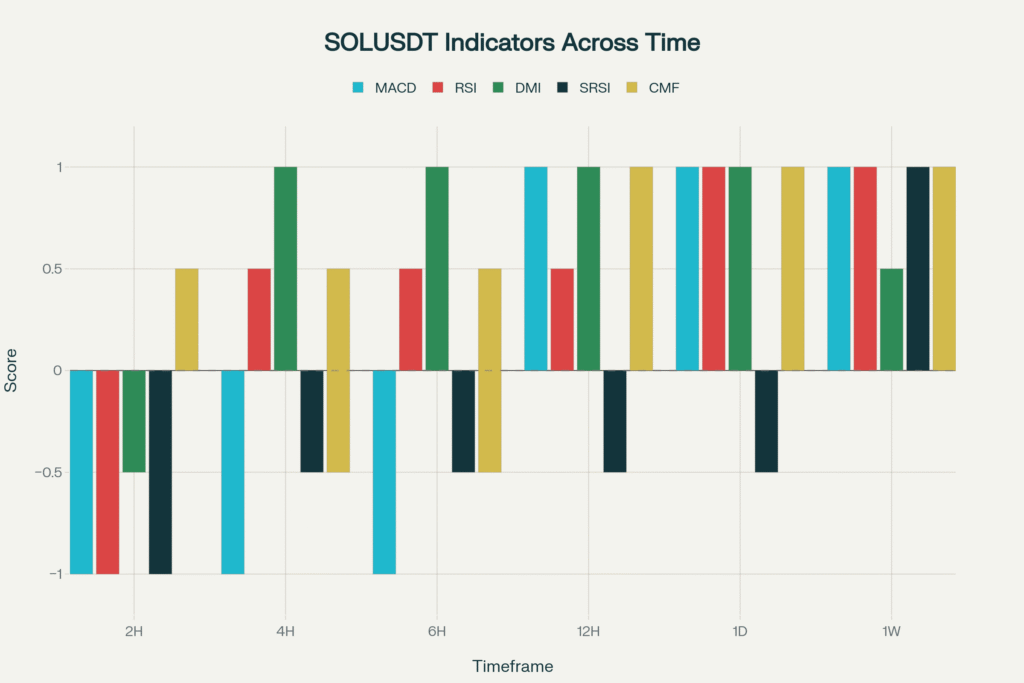
SOLUSDT presents a compelling technical narrative as we navigate through Monday’s session, with the token trading around $236.74 after experiencing modest pressure from recent highs. The multi-timeframe analysis reveals an intriguing divergence between short-term consolidation signals and longer-term bullish momentum that continues to underpin the asset’s structural integrity. Lower timeframes show bearish MACD crossovers and RSI readings below key thresholds, suggesting immediate overhead pressure as profit-taking emerges near previous resistance zones around $239-243. However, the daily and weekly perspectives paint a markedly different picture, with robust MACD momentum, RSI strength above moving averages, and DMI readings confirming sustained buying interest across institutional timeframes.
The DEMA structure provides crucial context for understanding current price action, with shorter-term DEMAs at $234.30 and $225.57 offering graduated support levels, while longer-term averages remain well below current prices, indicating the broader uptrend remains intact despite near-term choppiness. Money flow indicators suggest cautious optimism, with CMF readings showing modest positive flows on higher timeframes while remaining neutral on shorter intervals. This creates an environment where tactical pullbacks toward the $234-236 zone could present attractive entry opportunities for position builders.
Looking ahead, we anticipate continued oscillation within the $234-243 range over the next 24-48 hours, with any decisive break above $243 likely triggering momentum toward the $250 ceiling level. The convergence of multiple support levels near $234 suggests this area should provide reliable demand, making any weakness toward these levels a potential buying opportunity rather than cause for concern. Risk management remains paramount, with stops below $234 for new long positions and breakout entries above $239.50 for momentum plays.
#SOLUSDT #CryptoAnalysis #TechnicalAnalysis #Solana #TradingStrategy #DeFi
 #SOLUSDT #CryptoAnalysis #TechnicalAnalysis #Solana #TradingStrategy #DeFi
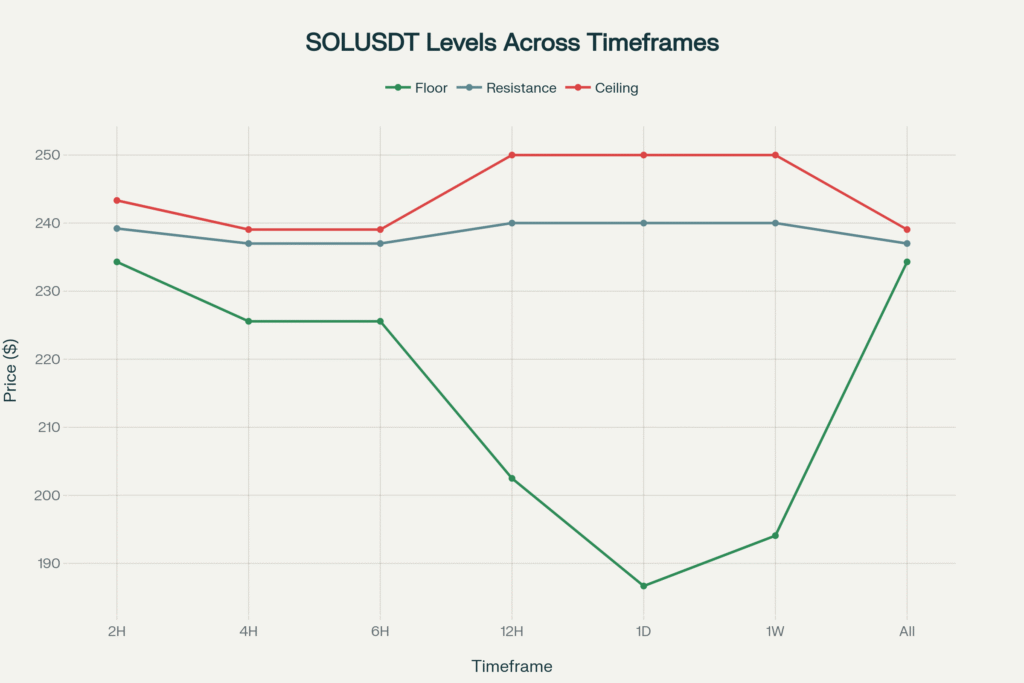 #SOLUSDT #CryptoAnalysis #TechnicalAnalysis #Solana #TradingStrategy #DeFi
Indicators graph +-1 bullish bearish , +-0.5 weak exhausted bullish bearish , bar extending -0.5 to +0.5 neutral ( no direction)
📜 Disclaimer ⚠️
The content in this publication is for informational and educational purposes only and does not constitute financial, investment, or trading advice. I am not a licensed financial advisor.
Any opinions, strategies, or analyses shared reflect my personal views and experiences. I may hold positions in the cryptocurrencies mentioned (e.g., BTC, ETH, SOL), which could influence my perspective.
Cryptocurrency markets are highly volatile and involve significant risk. Always do your own research and consult a licensed financial advisor before making any investment decisions.
No guarantees are made regarding the accuracy, completeness, or profitability of any information provided. All opinions are subject to change as new information becomes available.
This content is intended for a general audience and may not comply with regulatory standards in your specific country or region. Invest responsibly.
