

Double click on the video for full screen!!
Solana’s Trap: Bullish Intraday Signals Clash with Macro Bearish Reality 2025 12 12
Solana enters the weekend at a decisive and dangerous juncture, trading at 138.68 and knocking on the door of the critical 140.00 resistance level. Compared to earlier in the week (Dec 9), where price was consolidating in the same region, the technical tension has significantly tightened. Short-term indicators on the 2-Hour and 4-Hour charts have flipped bullish, with price reclaiming local Moving Averages and MACD posting positive histograms. This suggests active accumulation by intraday traders who are betting on a tactical breakout.
However, zooming out reveals the structural “ceiling” that makes this setup a potential trap. The 12-Hour chart shows price strictly capped by the MA1 line at 139.66, a level that has acted as an iron barrier throughout this correction. Furthermore, the 1-Week chart remains deeply bearish with RSI at 40 and MACD strongly negative, indicating that this rally is likely a relief bounce within a larger corrective structure rather than a true reversal. The divergence in Chaikin Money Flow (CMF)—which is dipping on the 12H timeframe even as price attempts to rise—adds to the “fake-out” risk, warning that smart money may be using this strength to distribute rather than accumulate.
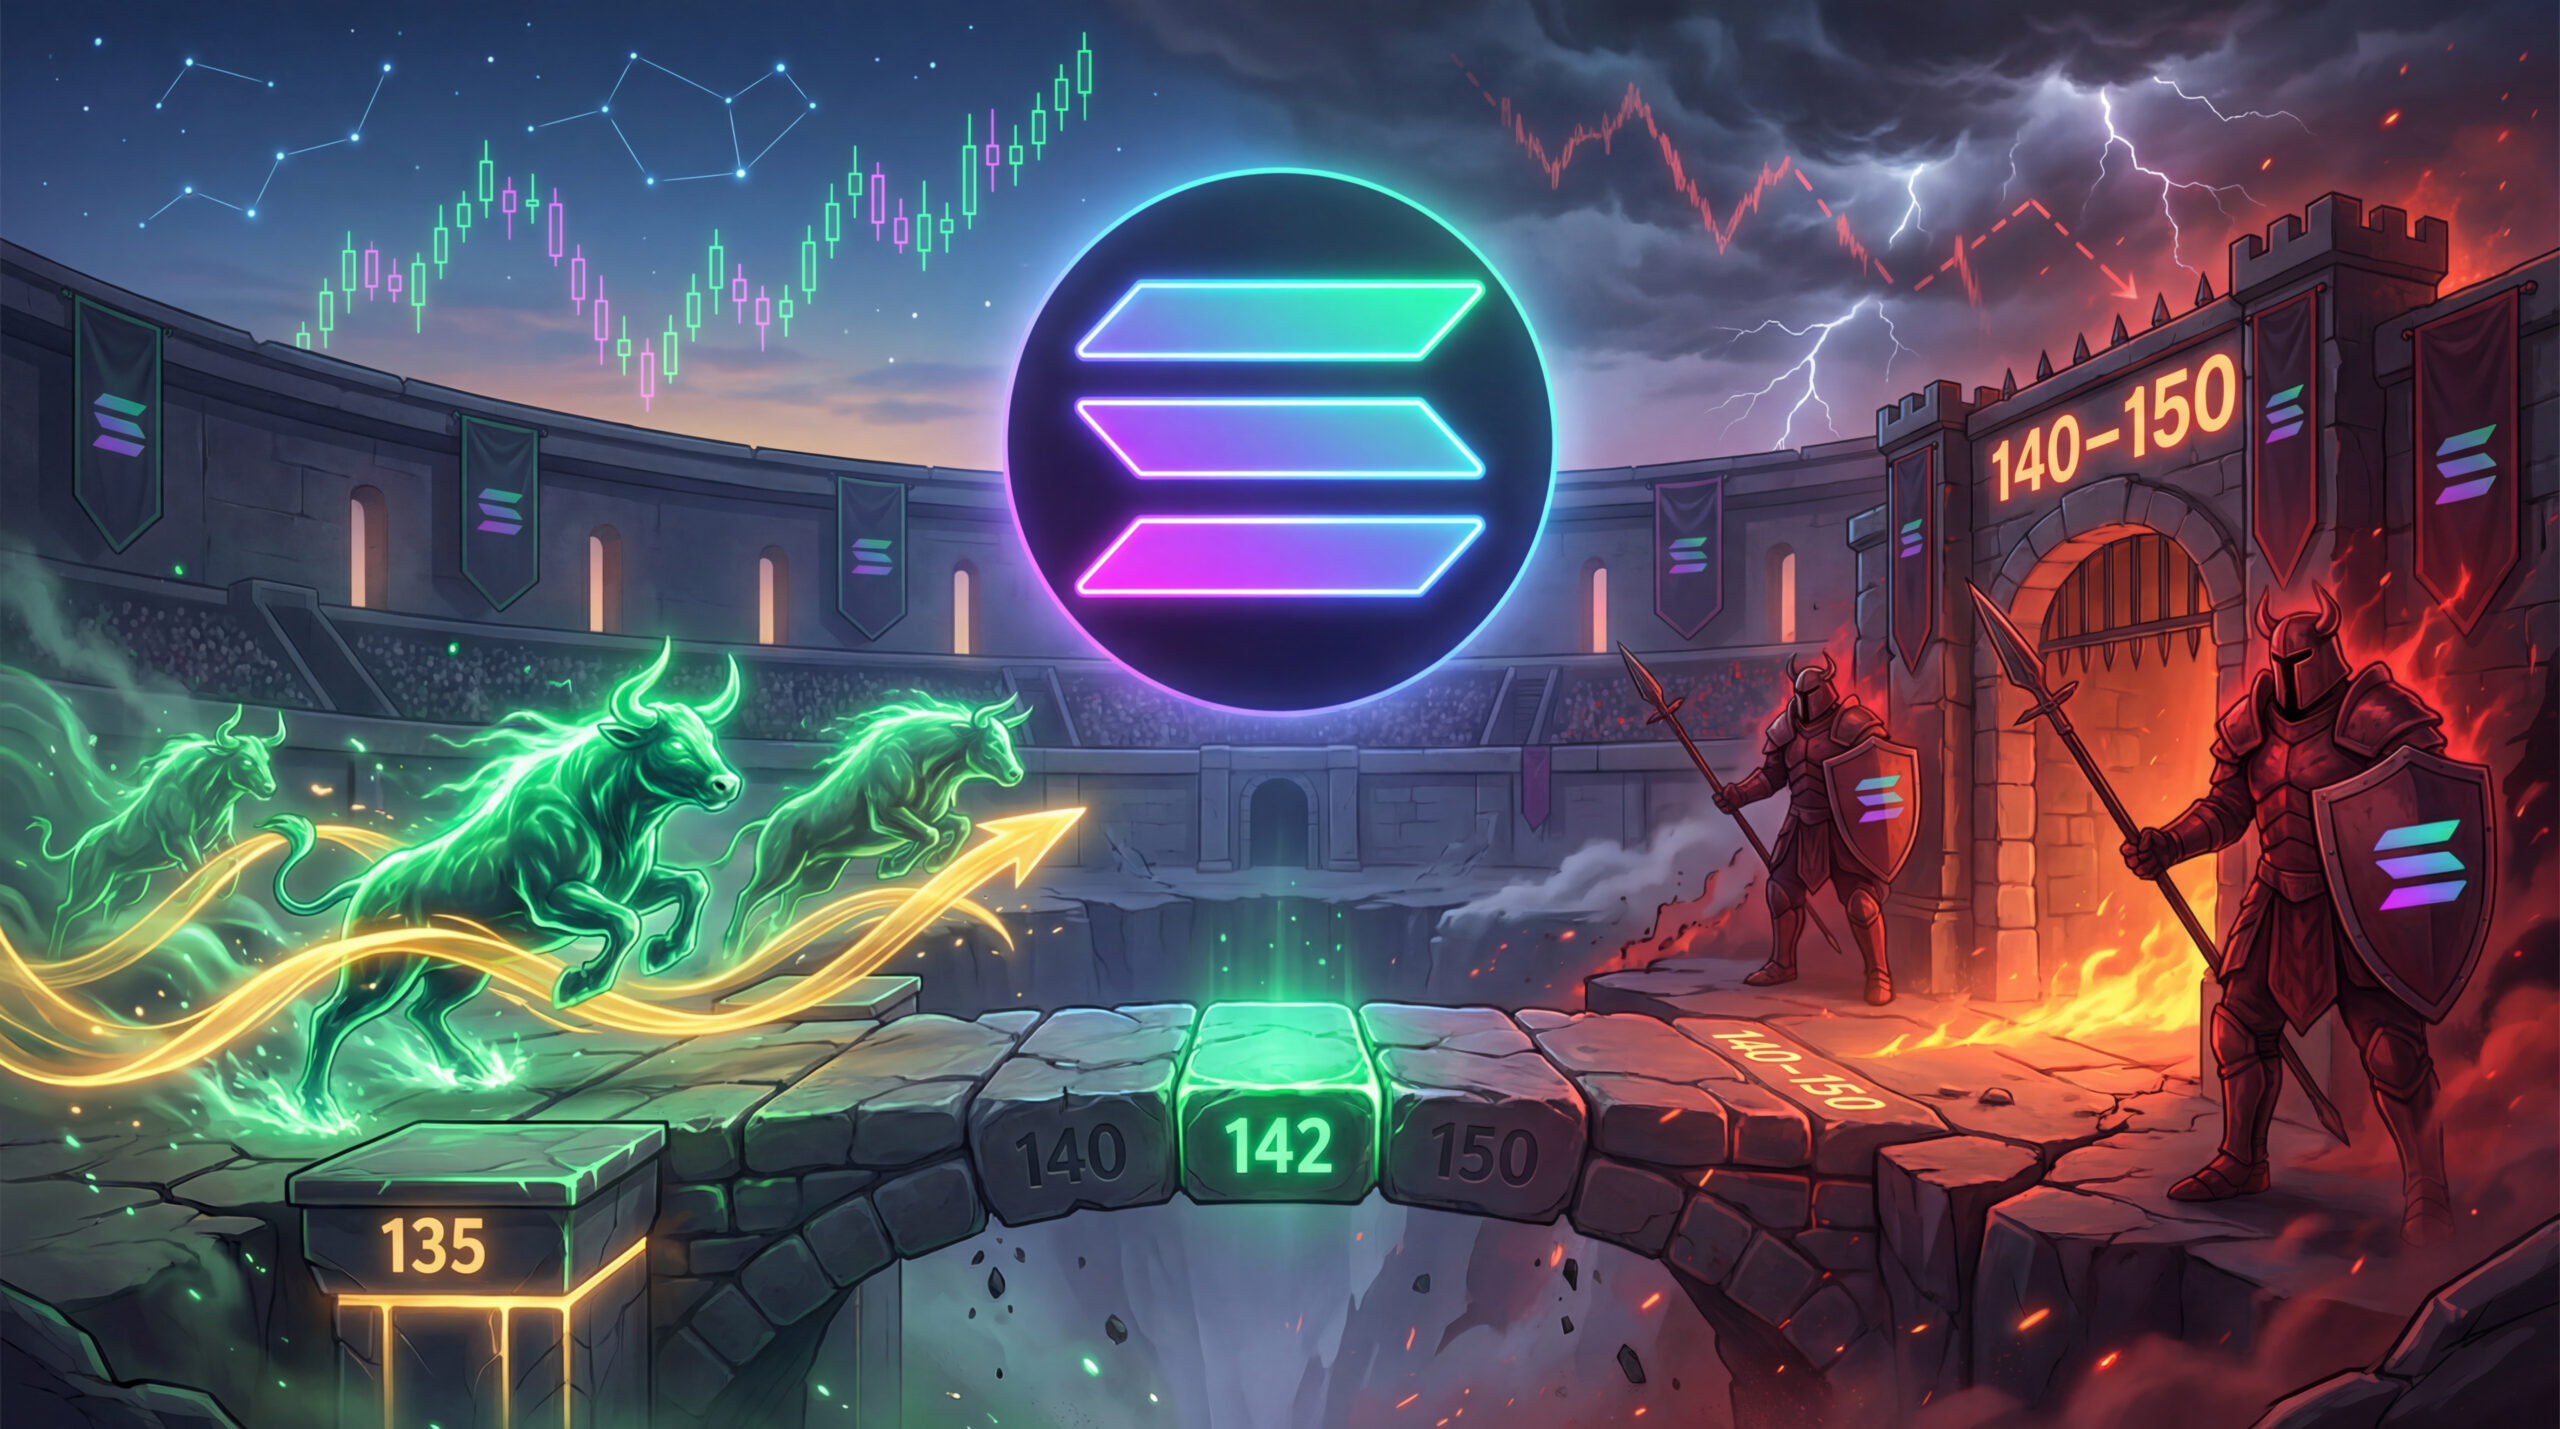
Verdict: The market is currently trapping both sides. Bulls are betting on the intraday momentum and the reclaim of short-term MAs, while bears are defending the macro resistance at 140-150. We favor a Consolidation scenario (50% probability) where SOL struggles to break 140 cleanly and eventually rotates lower. A rejection here targets a return to the 135.00 support floor. Traders should watch the 142.00 level closely—only a sustained close above this invalidate the immediate bearish thesis and opens the door for a test of 150. Until then, treat rallies as selling opportunities.
#SOLAnalysis #TechnicalAnalysis #CryptoTrading #BearMarket #SolanaPrice #ChartAnalysis
SOL/USDT Perpetual (Bybit)
Technical Analysis for SOL/USDT.P
Advanced Chart for SOL/USDT.P
This chart visually represents the consensus indicator scores across all analyzed timeframes, providing a clear, at-a-glance view of the prevailing market sentiment.
-1 = Bearish 🧸 ,+1=Bullish 🐂 ,+-0.5 weak Bullish/Bearish , 0(0.5-0.5) = Neutral
This chart plots the key price levels—floor, resistance, and ceiling—that we identified for each timeframe. It helps in visualizing the critical support and resistance zones.
Disclaimer
The content in this publication is for informational and educational purposes only and does not constitute financial, investment, or trading advice. I am not a licensed financial advisor.
Any opinions, strategies, or analyses shared reflect my personal views and experiences. I may hold positions in the cryptocurrencies mentioned (e.g., BTC, ETH, SOL), which could influence my perspective.
Cryptocurrency markets are highly volatile and involve significant risk. Always do your own research and consult a licensed financial advisor before making any investment decisions.
No guarantees are made regarding the accuracy, completeness, or profitability of any information provided. All opinions are subject to change as new information becomes available.
This content is intended for a general audience and may not comply with regulatory standards in your specific country or region. Invest responsibly.
