


SOL/USDT Today vs. Yesterday: Reflection and Outlook (06.10.2025)
Yesterday, SOL broke above its cluster of DEMAs and held support around the 228 level, showing renewed bullish conviction after a brief pullback. The MACD histograms had flattened, hinting at exhaustion, but buyers stepped in near the daily DEMA zone to push price back toward 235. Volume was moderate, and on–balance indicators such as the Chaikin Money Flow remained mildly positive. Short-term oscillators—including the 2-hour and 4-hour Stochastic RSI—registered overbought readings, signaling limited upside beyond 240 without an interim consolidation.
Today, Solana has largely confirmed that pause. Price action has traded in a 232–238 range, repeatedly testing resistance at 238 but failing to break decisively through. The 6-hour MACD crossed slightly below its signal line, reflecting weakening momentum, while the 12-hour and daily ADX values have ticked downward, suggesting trend strength is waning. Nevertheless, RSI remains perched above its moving average on the daily timeframe, and the weekly MACD retains its bullish bias, indicating that the broader uptrend remains intact. In sum, upside is capped near 240–242 in the near term, with support lying at 230–232.
Success thus far has been modest: yesterday’s bounce off the 228 floor led to a 3-point gain into 235, but subsequent rejections at the upper DEMAs demonstrate the need for caution. Overbought readings across multiple timeframes warn that chasing new highs could result in a pullback toward the mid-range.
Looking ahead, if SOL can secure a clean break and close above 240 on solid volume, the next target becomes the 245–250 zone. Conversely, failure to hold 232 risks a deeper retracement to 225. Traders might consider entering long near 230–232 with a stop under 228, capturing gains into 240 while respecting exhaustion signals.
Hashtags:
#SolanaAnalysis #CryptoTrading #SOLUSDT #MarketOutlook #TechnicalAnalysis #TrendExhaustion
SOL/USDT Perpetual (Bybit)
Technical Analysis for SOL/USDT.P
Advanced Chart for SOL/USDT.P
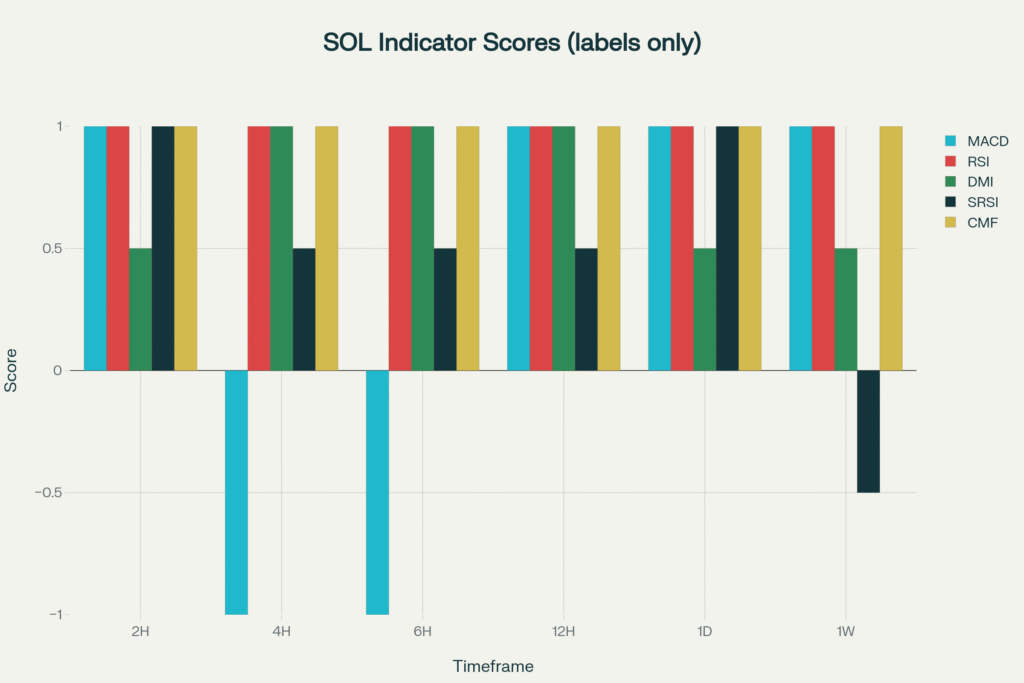
This chart visually represents the consensus indicator scores across all analyzed timeframes, providing a clear, at-a-glance view of the prevailing market sentiment.
-1 = Bearish 🧸 ,+1=Bullish 🐂 ,+-0.5 weak Bullish/Bearish , 0(0.5-0.5) = Neutral
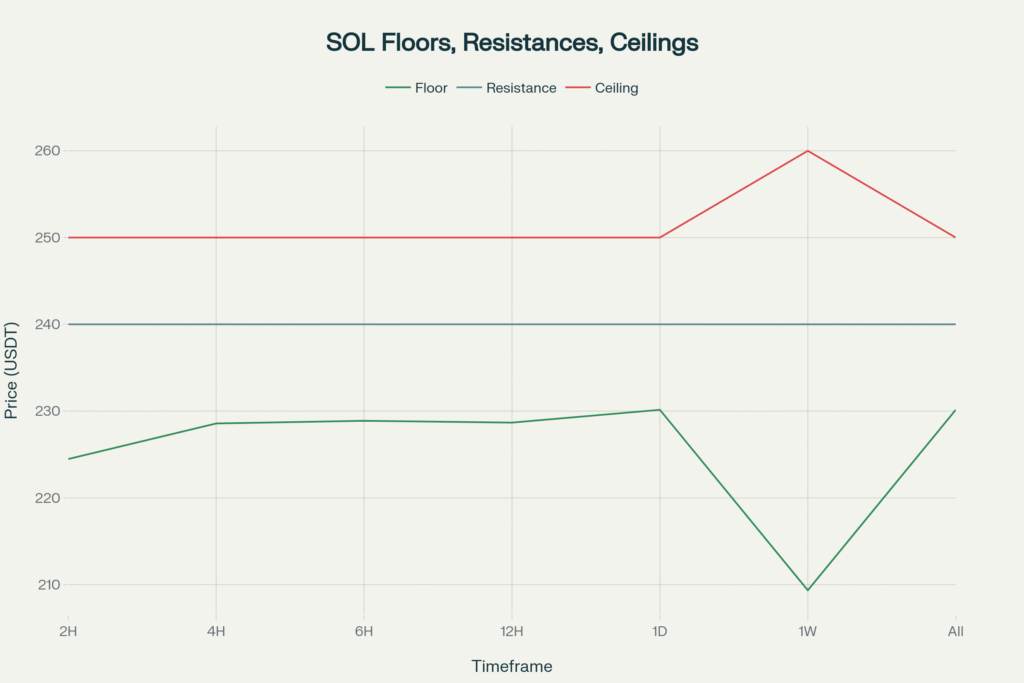
This chart plots the key price levels—floor, resistance, and ceiling—that we identified for each timeframe. It helps in visualizing the critical support and resistance zones.
Disclaimer
The content in this publication is for informational and educational purposes only and does not constitute financial, investment, or trading advice. I am not a licensed financial advisor.
Any opinions, strategies, or analyses shared reflect my personal views and experiences. I may hold positions in the cryptocurrencies mentioned (e.g., BTC, ETH, SOL), which could influence my perspective.
Cryptocurrency markets are highly volatile and involve significant risk. Always do your own research and consult a licensed financial advisor before making any investment decisions.
No guarantees are made regarding the accuracy, completeness, or profitability of any information provided. All opinions are subject to change as new information becomes available.
This content is intended for a general audience and may not comply with regulatory standards in your specific country or region. Invest responsibly.
