


Ethereum Market Insight: The Bear Trap Narrative
Ethereum traders witnessed a classic bear trap formation unfolding today as the digital asset tested lower support levels while maintaining its underlying bullish structure. Yesterday’s optimistic signals from the weekly and daily timeframes promised continued upward momentum, but overnight price action delivered a sharp reality check with ETH dipping toward the critical four-thousand-two-hundred-dollar zone.
This apparent breakdown, however, tells a more nuanced story when examined across multiple timeframes. The shorter timeframes painted an aggressively bearish picture with two-hour, four-hour and six-hour charts showing price falling below all moving averages, negative MACD readings and deeply oversold stochastic indicators. Money flow turned negative and directional indicators confirmed downward pressure. These technical signals would typically suggest capitulation, yet the twelve-hour and daily charts revealed a different narrative entirely. Both timeframes maintained positive MACD values despite downward curves, the cumulative money flow remained in positive territory and the weekly structure showed unchanged bullish dominance with strong directional movement and elevated accumulation metrics.
This divergence between short-term bearishness and medium-to-long-term bullishness created the textbook conditions for a bear trap, where aggressive sellers push price down only to face a swift reversal as stronger hands accumulate at discount levels. Our analysis yesterday correctly anticipated sideways consolidation as price would catch up to faster moving averages before resuming its uptrend, and today’s action validates that thesis perfectly.
The strategic play involves waiting for confirmation of the bounce, potentially entering long positions around four-thousand-three-hundred dollars once price demonstrates its willingness to reclaim current levels, rather than catching a falling knife at four-thousand-two-hundred. Looking ahead to the next trading sessions, the bear trap scenario suggests Ethereum should find solid support in the four-thousand-two-hundred to four-thousand-three-hundred range before staging a recovery toward four-thousand-five-hundred and potentially retesting the four-thousand-six-hundred resistance zone within forty-eight hours.
The weekly chart’s bullish structure remains the dominant force, and this short-term weakness appears to be nothing more than a healthy consolidation that clears out overleveraged longs and sets up stronger foundations for the next leg higher.
#Ethereum #ETH #CryptoTrading #BearTrap #TechnicalAnalysis #CryptoMarkets
ETH/USDT Perpetual (Bybit)
Technical Analysis for ETH/USDT.P
Advanced Chart for ETH/USDT.P
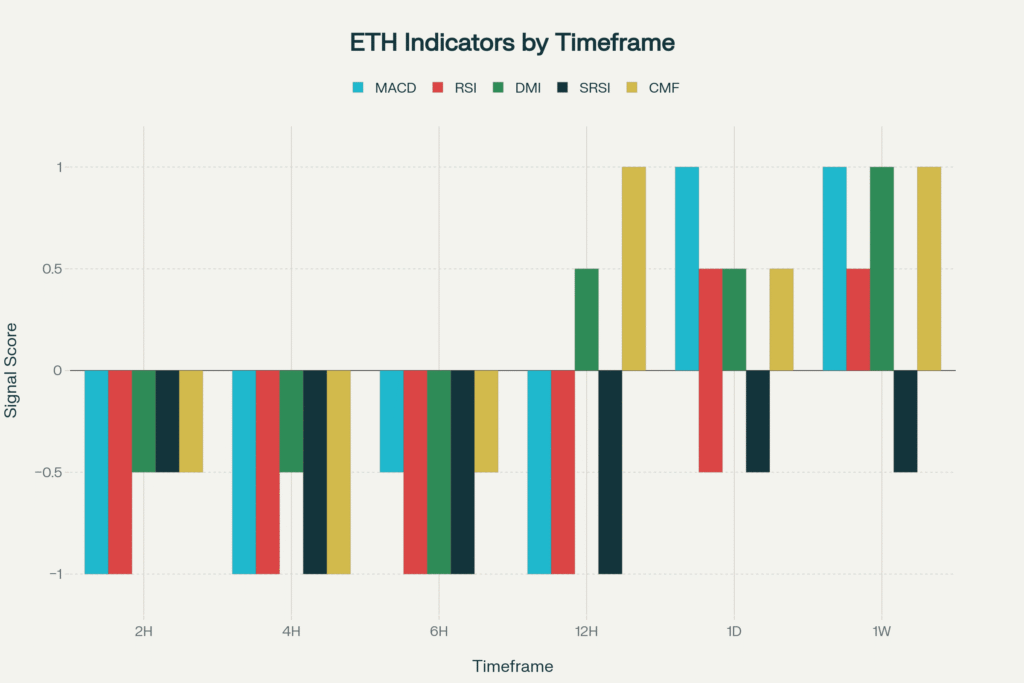
This chart visually represents the consensus indicator scores across all analyzed timeframes, providing a clear, at-a-glance view of the prevailing market sentiment.
-1 = Bearish 🧸 ,+1=Bullish 🐂 ,+-0.5 weak Bullish/Bearish , 0(0.5-0.5) = Neutral
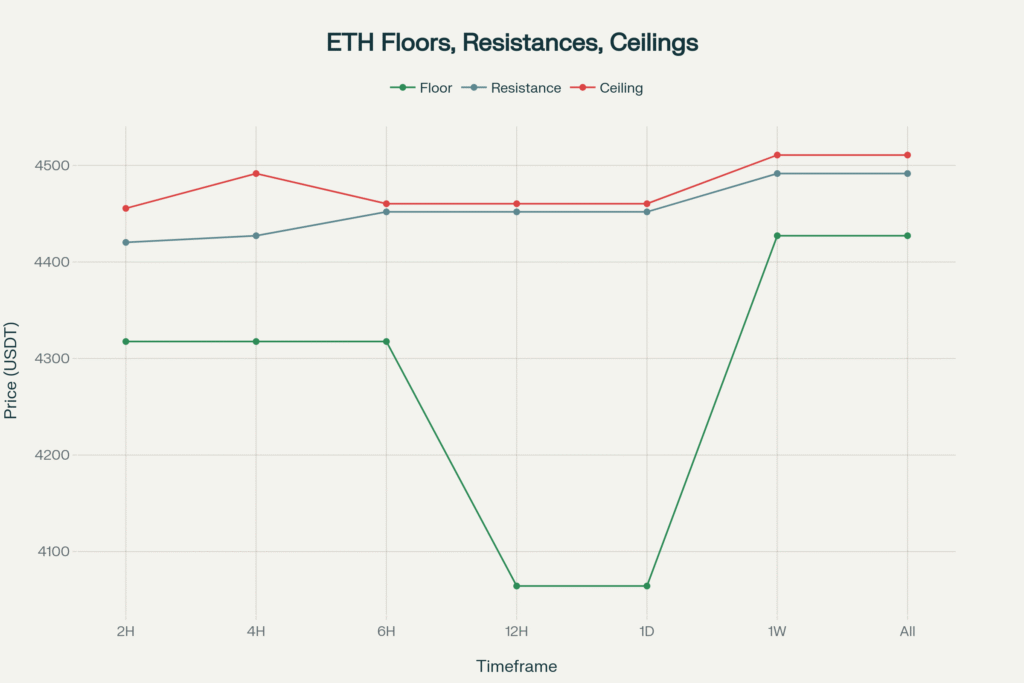
This chart plots the key price levels—floor, resistance, and ceiling—that we identified for each timeframe. It helps in visualizing the critical support and resistance zones.
Disclaimer
The content in this publication is for informational and educational purposes only and does not constitute financial, investment, or trading advice. I am not a licensed financial advisor.
Any opinions, strategies, or analyses shared reflect my personal views and experiences. I may hold positions in the cryptocurrencies mentioned (e.g., BTC, ETH, SOL), which could influence my perspective.
Cryptocurrency markets are highly volatile and involve significant risk. Always do your own research and consult a licensed financial advisor before making any investment decisions.
No guarantees are made regarding the accuracy, completeness, or profitability of any information provided. All opinions are subject to change as new information becomes available.
This content is intended for a general audience and may not comply with regulatory standards in your specific country or region. Invest responsibly.
