


-

Solana Finds Critical Support: Will $200 Mark the Reversal? (20251013PM).
The current technical setup presents a clear make-or-break scenario centered on two critical price levels. Support at $195 must hold to maintain bullish structure integrity, while a decisive break above $200 would confirm trend resumption and likely trigger additional technical buying. The risk-reward profile at current levels favors long positioning,…
-

Ethereum Shows Promising Reversal Signs After Challenging Weekend (20251310PM)
The critical level to watch moving forward is forty-two hundred dollars. Price needs to reclaim and hold this zone to confirm the reversal is genuine rather than just another bear market bounce. Support has solidified in the forty-one hundred to forty-one fifty range, creating a relatively tight risk zone for…
-
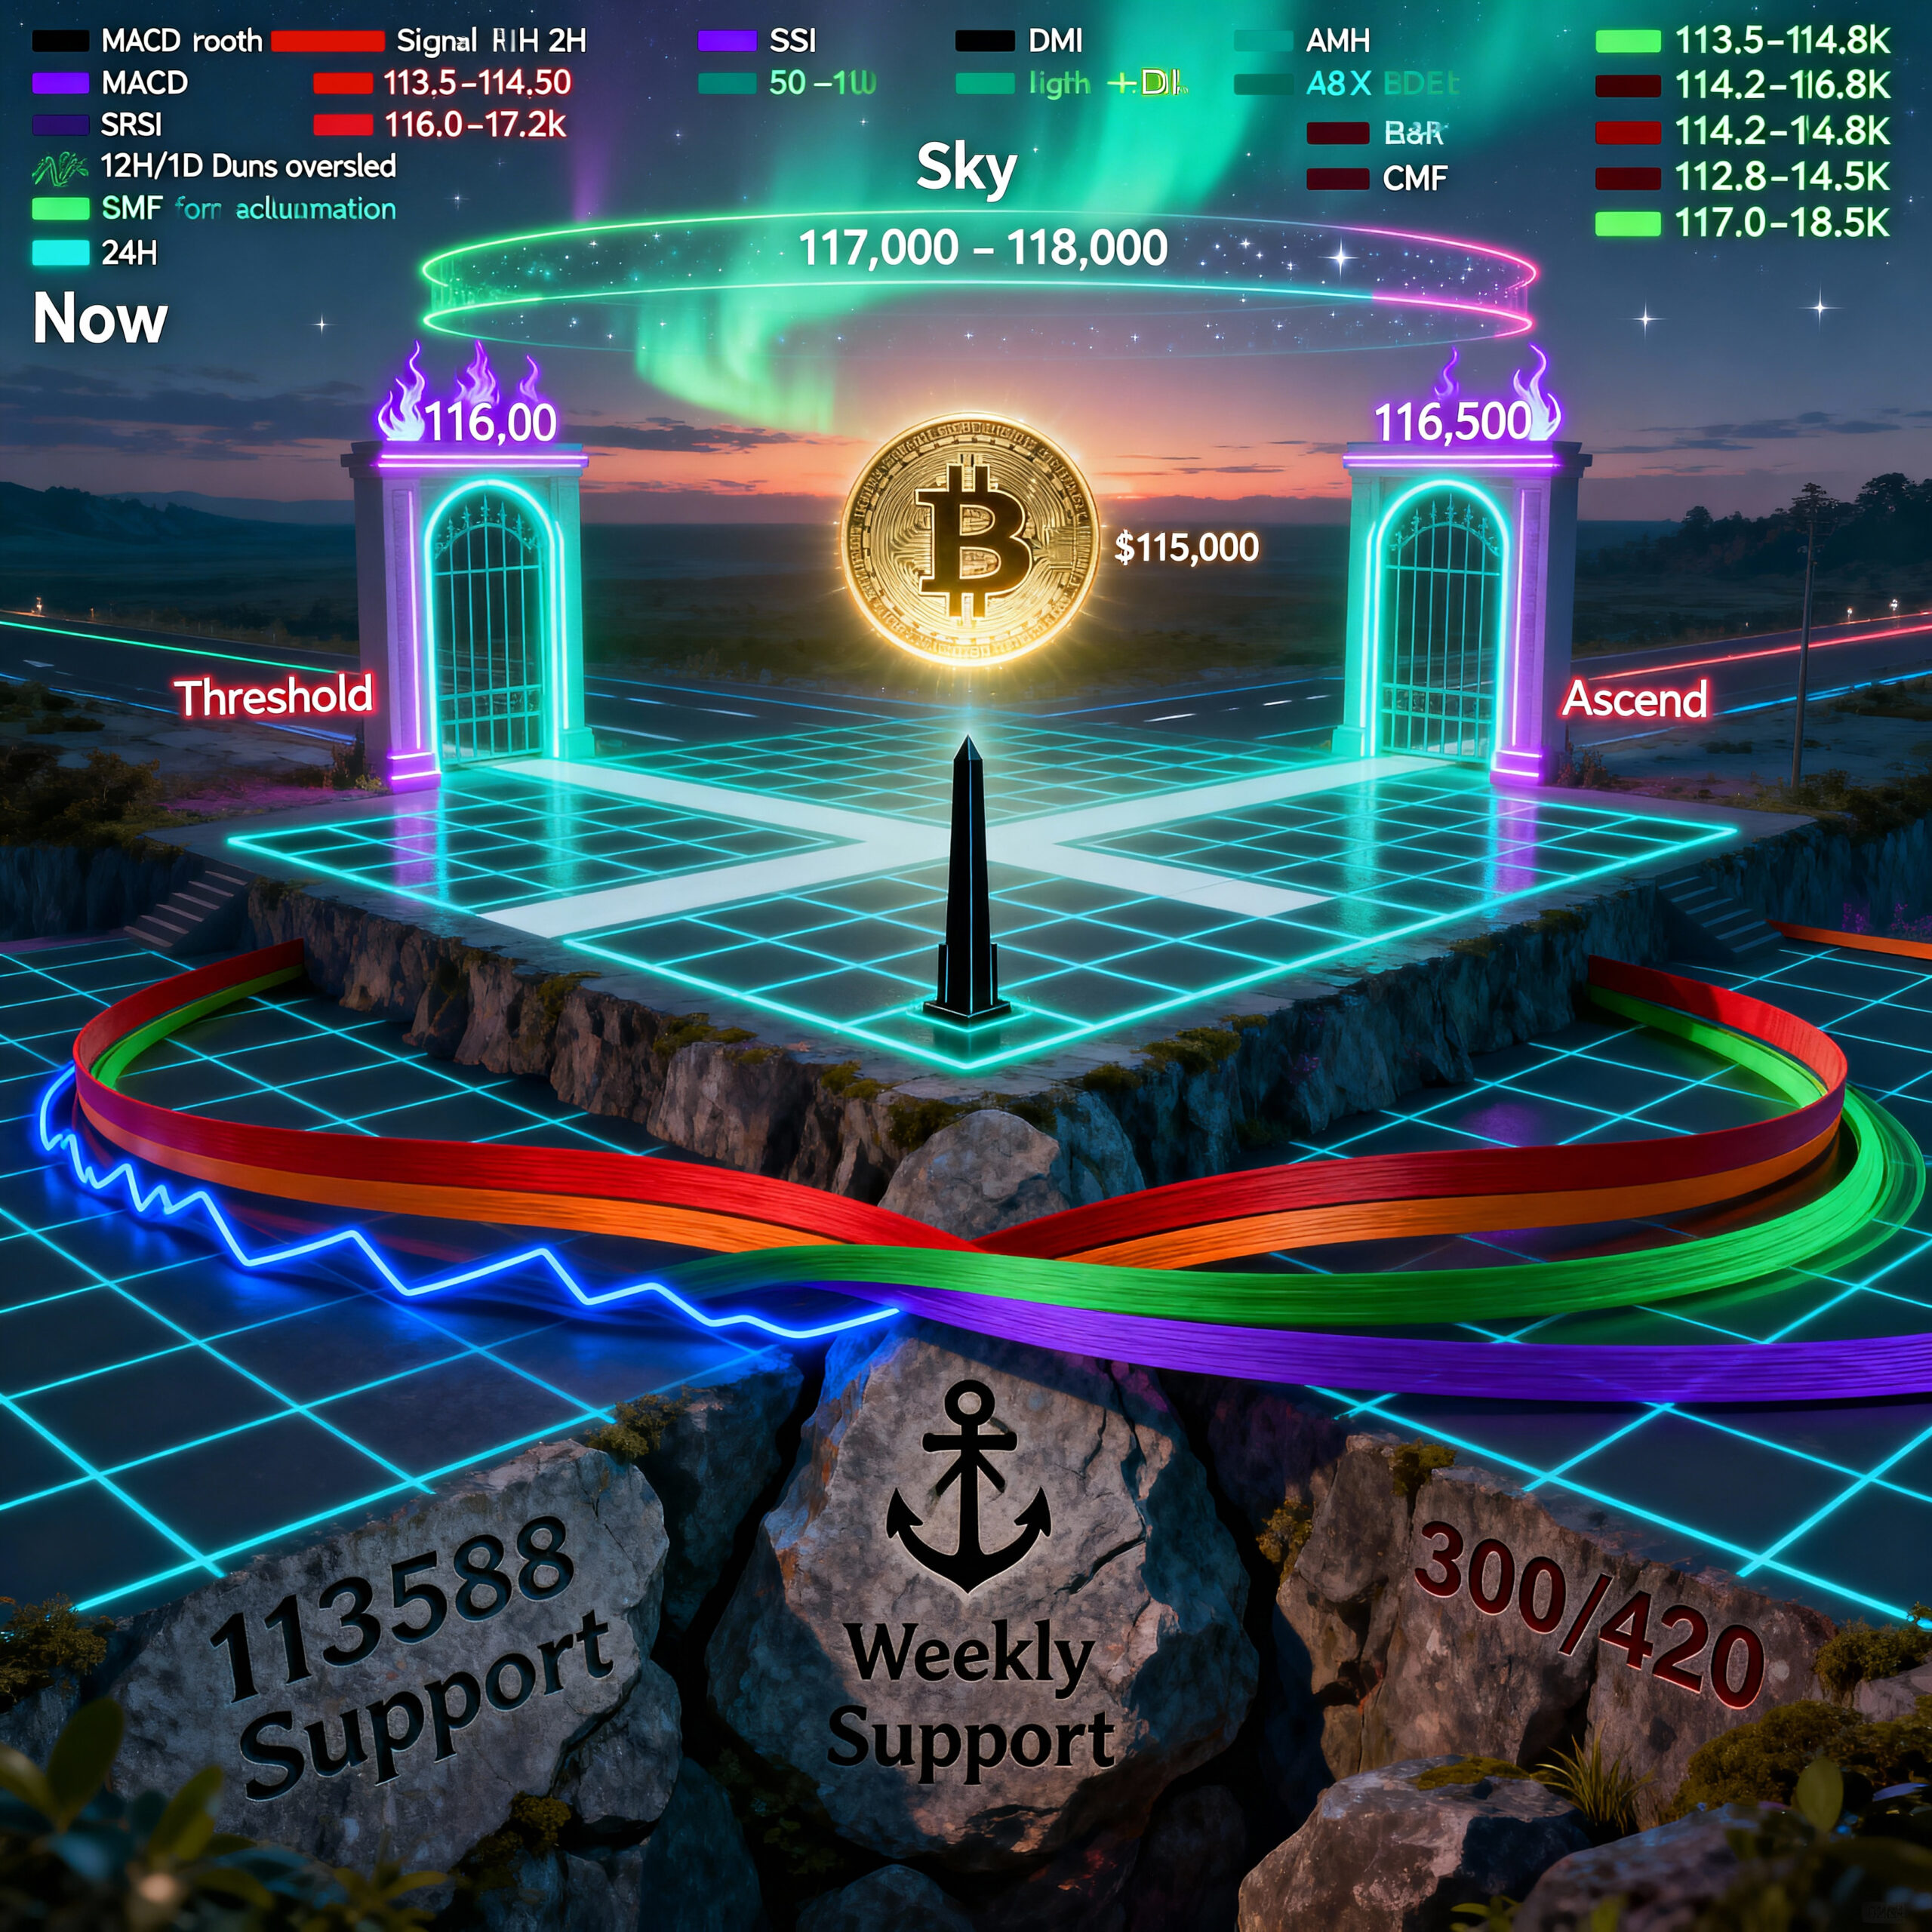
Bitcoin Reaches Critical Pivoting Point at $115K: Will the Bulls Reclaim Control?(20251013PM)
Looking ahead, Bitcoin appears positioned for renewed upward momentum once current oversold conditions resolve. Support holds firm between $120,000-$121,500, with resistance targets at $124,000-$125,000 coming into focus. The convergence of oversold shorter timeframes and bullish longer timeframes creates an attractive risk-reward setup favoring longs
-

AAVE Bulls Fight Back: Critical $260 Test Ahead (20251014 PM)
Our forecast centers on the 270-295 range as the battleground for the next 48 hours, with a bias toward downside continuation unless we see decisive reclamation of 285 with strong volume. Traders should watch for potential short-term bounces from extreme oversold conditions but maintain awareness that the structural bearish setup…
-
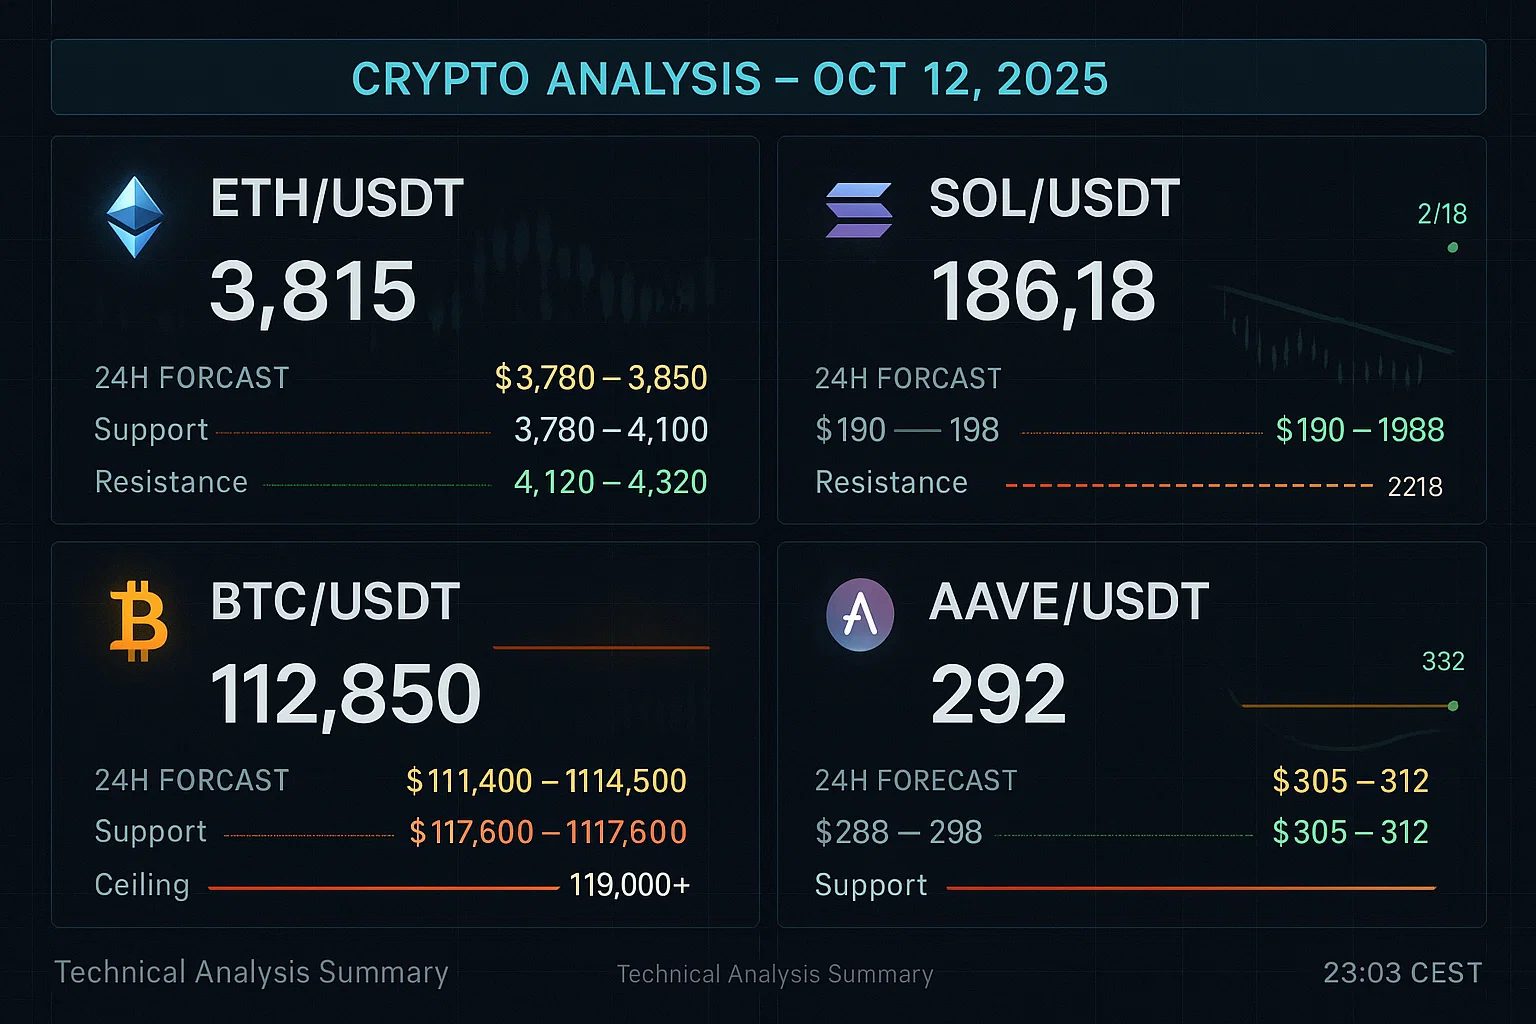
AAVE , BTC, ETH , SOL / USDT – UPDATE – 2025 10 12 – AM
Disclaimer The content in this publication is for informational and educational purposes only and does not constitute financial, investment, or trading advice. I am not a licensed financial advisor. Any opinions, strategies, or analyses shared reflect my personal views and experiences. I may hold positions in the cryptocurrencies mentioned (e.g., BTC, ETH, SOL), which could influence…
-
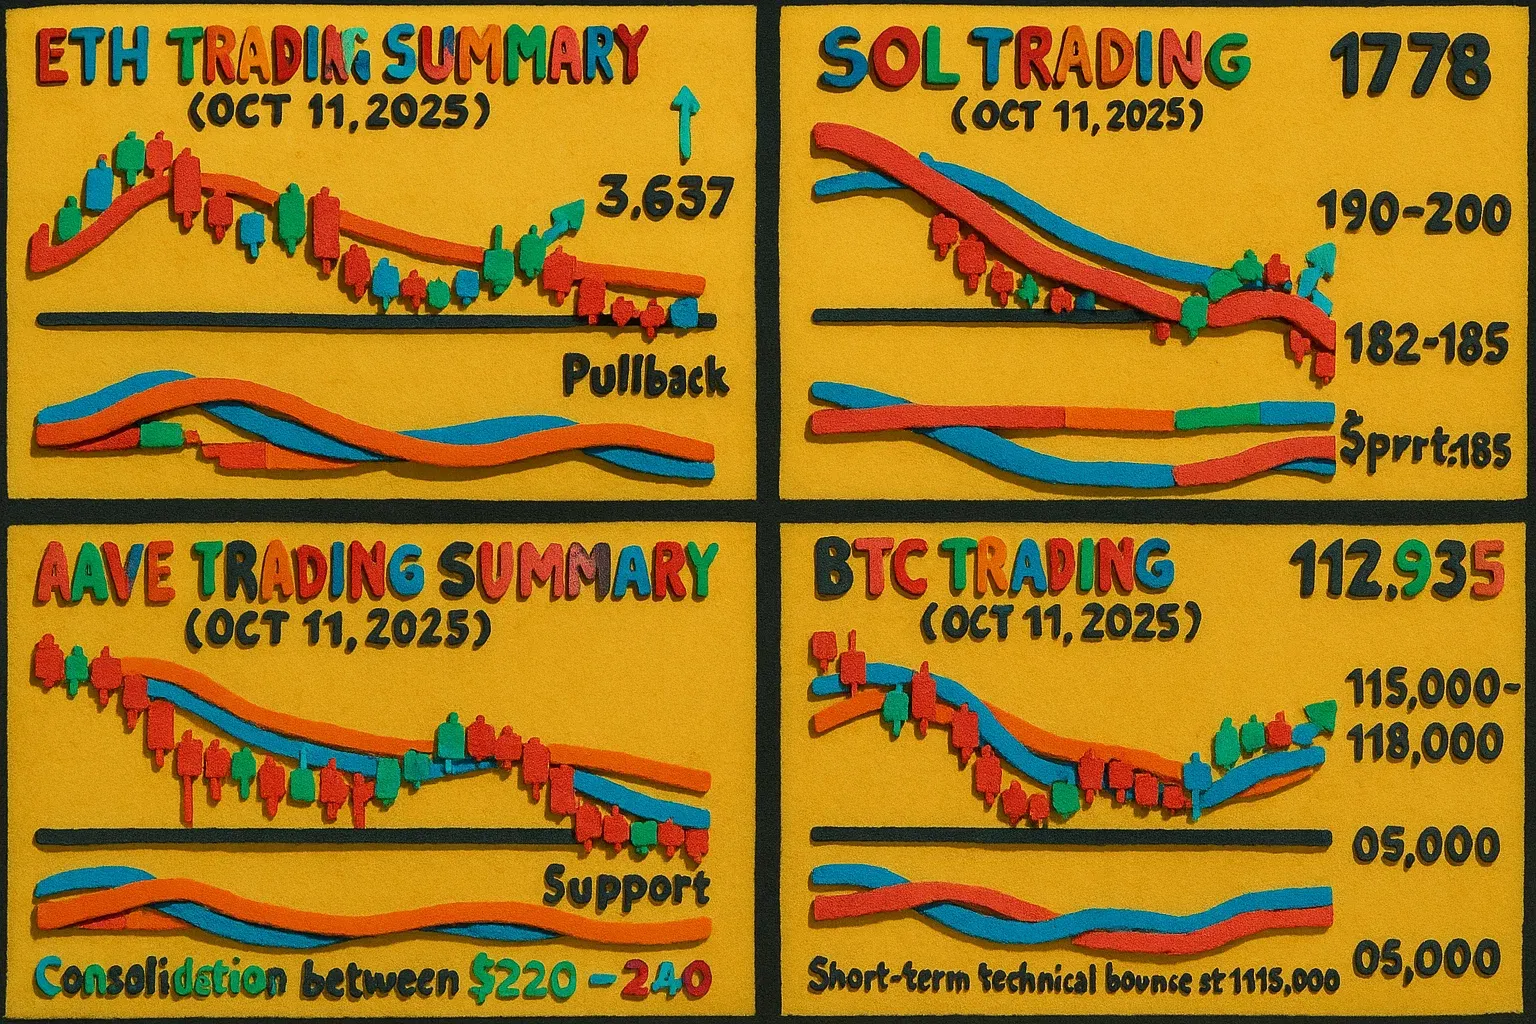
AAVE , BTC, ETH , SOL / USDT – UPDATE – 2025 10 11 – AM
Disclaimer The content in this publication is for informational and educational purposes only and does not constitute financial, investment, or trading advice. I am not a licensed financial advisor. Any opinions, strategies, or analyses shared reflect my personal views and experiences. I may hold positions in the cryptocurrencies mentioned (e.g., BTC, ETH, SOL), which could influence…
-
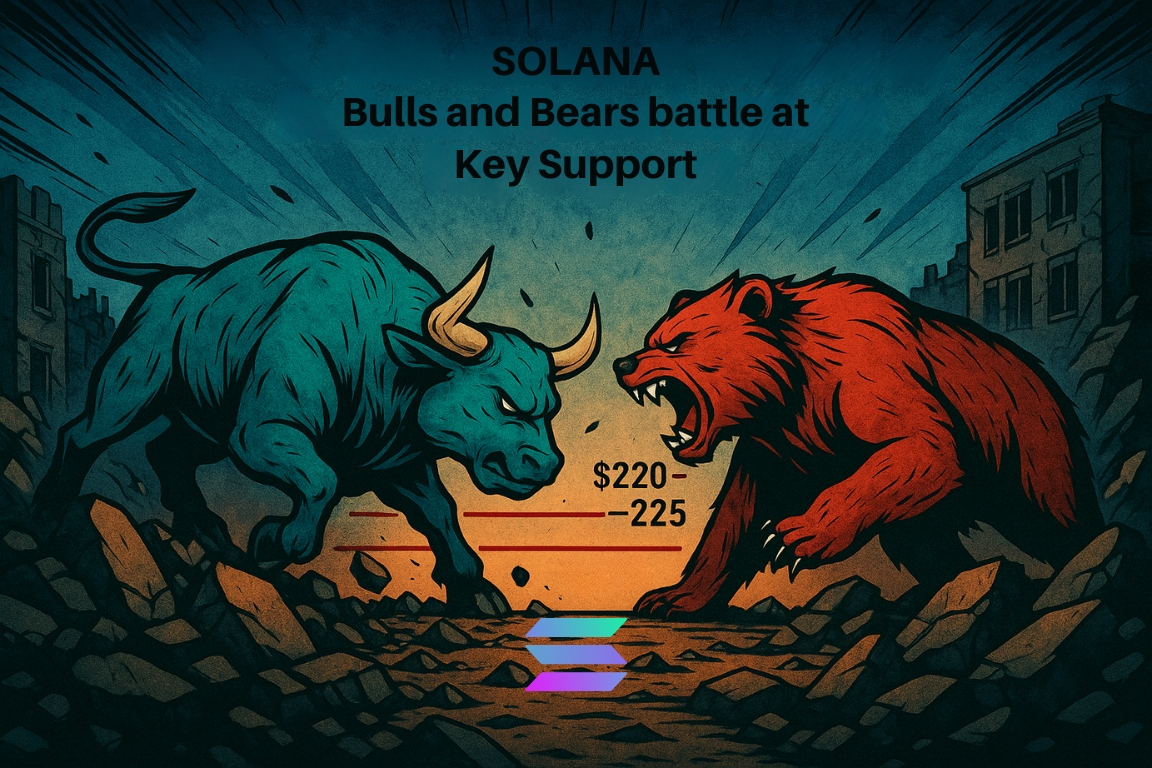
Solana Stands at Critical Crossroads as Bulls and Bears Battle at Key Support.
Looking ahead, the next twenty-four to forty-eight hours will determine Solana’s trajectory through year-end. If bulls can hold the $218-220 support zone and push above $228 resistance, a renewed uptrend targeting $235-240 becomes probable. However, a decisive break below $218 would likely trigger a retest of $210-212 support levels. For…
-

Ethereum Market Insight: The Bear Trap Narrative
This divergence between short-term bearishness and medium-to-long-term bullishness created the textbook conditions for a bear trap, where aggressive sellers push price down only to face a swift reversal as stronger hands accumulate at discount levels. Our analysis yesterday correctly anticipated sideways consolidation as price would catch up to faster moving…
-
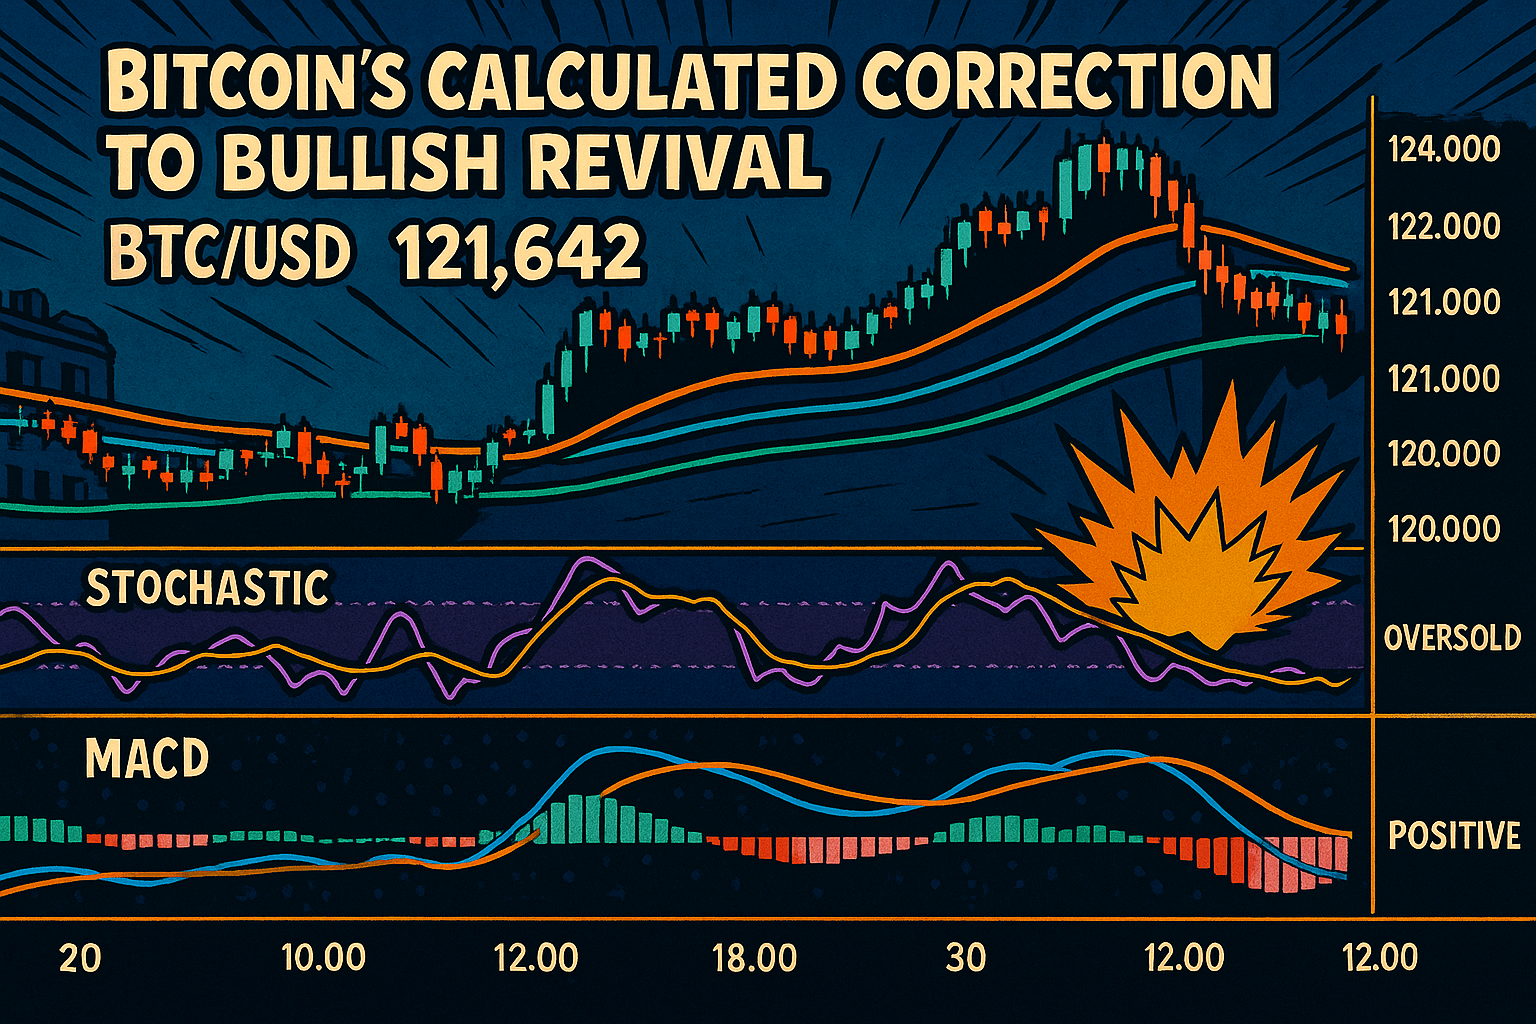
Bitcoin’s Calculated Correction Points to Bullish Revival.
Looking ahead, Bitcoin appears positioned for renewed upward momentum once current oversold conditions resolve. Support holds firm between $120,000-$121,500, with resistance targets at $124,000-$125,000 coming into focus. The convergence of oversold shorter timeframes and bullish longer timeframes creates an attractive risk-reward setup favoring longs
-
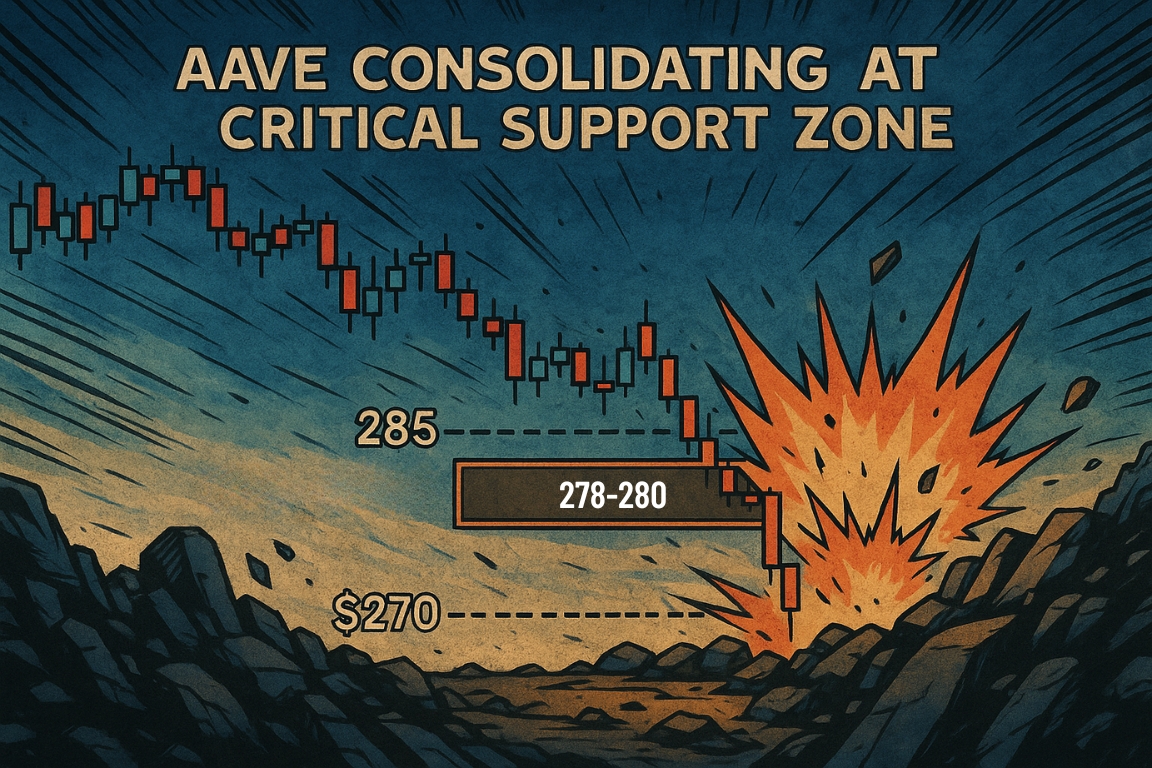
AAVE Consolidating at Critical Support Zone
Our forecast centers on the 270-295 range as the battleground for the next 48 hours, with a bias toward downside continuation unless we see decisive reclamation of 285 with strong volume. Traders should watch for potential short-term bounces from extreme oversold conditions but maintain awareness that the structural bearish setup…
-

SOL/USDT Today vs. Yesterday: Reflection and Outlook (06.10.2025)
Looking ahead, if SOL can secure a clean break and close above 240 on solid volume, the next target becomes the 245–250 zone. Conversely, failure to hold 232 risks a deeper retracement to 225. Traders might consider entering long near 230–232 with a stop under 228, capturing gains into 240…
-

Ethereum Decisively Breaks Out—Multi-Timeframe Bullish Signals Point to New Highs ( 06.10.2025)
Stochastic RSI on shorter timeframes is solidly overbought, indicating current demand remains robust, while higher timeframes trend neutral, which could buffer against immediate exhaustion. DMI across all intervals is bullish, with ADX strengthening, and positive money flow (CMF) confirming risk appetite. The only moderate caution is a leveling off in…