

-

SOLUSDT: Tight Consolidation Near Critical Juncture—Higher Timeframe Strength Intact 2025 09 15
SOLUSDT presents a compelling technical narrative as we navigate through Monday’s session, with the token trading around $236.74 after experiencing modest pressure from recent highs. The multi-timeframe analysis reveals an intriguing divergence between short-term consolidation signals and longer-term bullish momentum that continues to underpin the asset’s structural integrity. Lower timeframes…
-

ETH/USDT: Consolidation After Correction, Bullish Structure Holds
Ethereum has paused after a modest correction in early September, with ETH/USDT trading around $4,573–$4,608 as of today. The immediate picture is one of short-term fatigue—especially on the 2-hour and 4-hour charts, where MACD and CMF have turned negative and selling volume is evident. However, this weakness is not mirrored…
-

Bitcoin Technical Analysis Update: September 15, 2025
Bitcoin continues to demonstrate its characteristic volatility as market participants grapple with conflicting signals across multiple timeframes. Today’s analysis reveals a complex tapestry of momentum indicators suggesting neither bulls nor bears have established decisive control, though subtle shifts in underlying technicals paint an increasingly constructive picture for the days ahead.…
-

AAVE/USDT: Sell Zone Holds, 300 In Focus
AAVE/USDT is pinned beneath clustered resistances marked by labeled DEMAs at 307.96 on 2H, 310.93 on 4H, and 312.76 on 1D, while spot hovers around the 306 handle on the provided charts. Momentum remains soft across intraday frames, with sub‑zero MACD histograms and MACD below Signal on 2H/4H/6H, and RSI…
-

SOL Soars: Riding the Weekly Wave While Eyeing Smart Entries
Solana delivered another impressive performance yesterday, continuing its relentless march higher as our multi-timeframe analysis correctly identified the underlying bullish momentum. The token pushed above $247, validating our long bias from previous sessions and demonstrating the power of higher timeframe analysis over short-term noise. What we witnessed was a textbook…
-

ETH Testing Key Resistance as Daily Momentum Builds Despite Mixed Breadth Signals
ETH’s daily momentum turned constructive with MACD and RSI both confirming upside while weekly remains decisively bullish, yet intraday breadth shows caution with a negative CMF and an overbought, lagging Stoch RSI that tempers follow-through expectations near first resistances. Yesterday’s mixed intraday profile evolved into a cleaner push, but…
-

BTC at an Inflection Between Midframe Pullback and Daily Reclaim
Bitcoin spent today oscillating around the mid‑115k area, where mid‑timeframe selling pressure met improving liquidity, producing a choppy tape that lacked decisive follow‑through in either direction. Yesterday hinted at a constructive advance, but momentum faded beneath the daily DEMA band at 117,115.7–117,255.7, leaving buyers short of a full trend reclaim…
-

Navigating the Crypto Tides: A Market of Opposing Forces
Short-Term Rallies Clash with Long-Term Resistance Across Major Altcoins and Bitcoin The cryptocurrency market is currently a theater of conflict, where short-term bullish surges are running into formidable long-term resistance levels. Across major assets like Bitcoin, Ethereum, Solana, and Aave, traders are witnessing a complex tug-of-war. While lower timeframes are…
-

The Crypto Market’s Precarious Pause.
Quick Read×Quick ReadThe market is experiencing a conflict between short-term exhaustion and long-term bullish optimism, particularly among major cryptocurrencies like Bitcoin and Ethereum.Bitcoin is facing strong resistance around $112,000, indicating potential for a ‘bull trap’ and a possible retreat to the $105,000 support level.Ethereum is consolidating within a bullish trend…
-

Crypto’s Balancing Act: Momentum Flickers, Structure Holds.
Quick Read×Quick ReadAAVE is in a cautious trading range, requiring a close above 321.6 to confirm upward momentum, with potential support levels at 314 and the high-290s.Bitcoin shows improved intraday momentum but struggles to break above key resistance levels at 113k and 114.9k, with a risk of further downside if…
-

Crypto Community Pulse Report — July to August 2025
Quick Read×Quick ReadEthereum’s community exhibited euphoric builder optimism in July, celebrating price rallies and staking wins, while in August, it shifted to a more serious focus on staking inflows and protocol upgrades.Bitcoin’s community transitioned from a lively, playful atmosphere in July to a patient waiting room mentality in August, reinforcing…
-
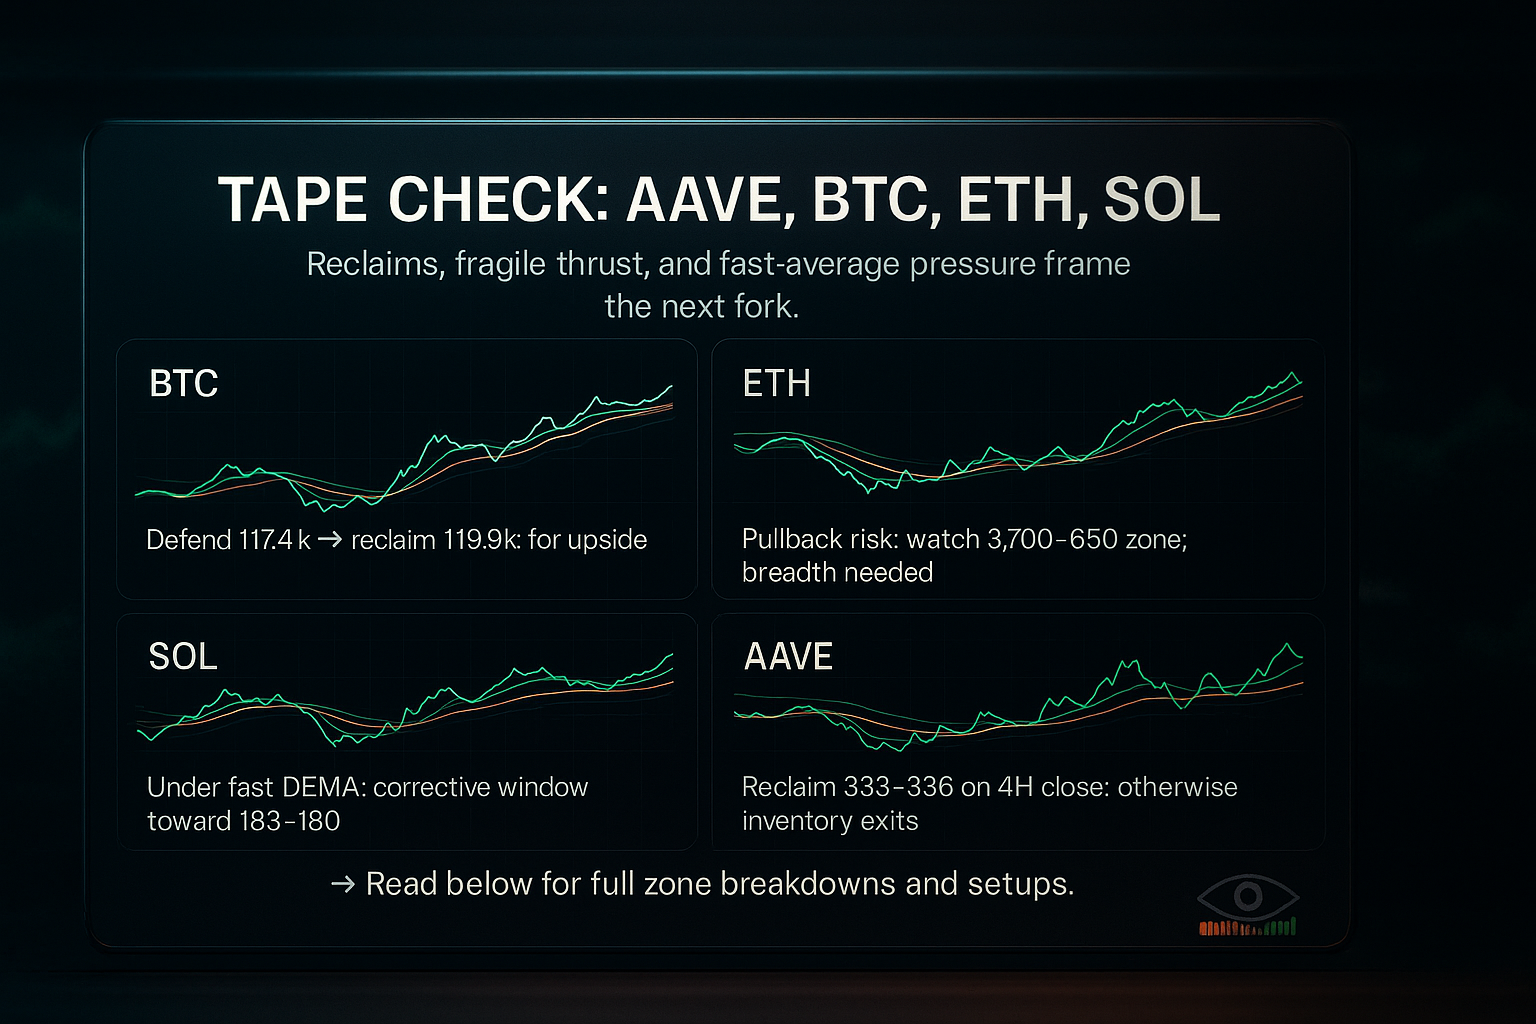
AAVE, BTC, ETH, SOL — Final Notes Recap – 29 08 2025
Quick Read×Quick ReadAAVE is currently waiting for a reclaim above the 333–336 range; until then, bounces should be treated as inventory exits.BTC’s structure remains intact but momentum is uneven; bulls must defend key levels around 117,400 and 116,200 to maintain a bullish bias.ETH is experiencing a higher-timeframe uptrend but faces…