


Bitcoin Reaches Exhaustion Zone as Technical Divergences Mount (06.10.2025)
Bitcoin’s impressive rally to $124,000 has brought the cryptocurrency into a critical technical zone where multiple indicators suggest momentum exhaustion. While price action remains superficially bullish across timeframes, deeper analysis reveals concerning divergences that veteran traders recognize as warning signs of an overextended market.
The most telling signals emerge from the relationship between price movement and underlying momentum. Despite Bitcoin trading well above its DEMA moving averages, the MACD indicator shows weakening momentum across multiple timeframes, with the signal line crossing above the MACD line on several charts. This creates a classic bearish divergence where price continues higher while momentum deteriorates underneath.
Equally concerning is the behavior of the Stochastic RSI, which recently triggered what technical analysts call a “bull trap” signal. After spiking above 80, the indicator has begun rolling over, suggesting the recent buying enthusiasm may be waning. Meanwhile, the traditional RSI remains overbought above 70, creating an unusual situation where short-term and longer-term momentum indicators tell conflicting stories.
The Directional Movement Index adds another layer of caution to the current setup. While the ADX shows strong trend strength, it has risen significantly above the positive directional indicator, creating an imbalance that typically resolves through either increased directional movement or weakening trend strength. Current market conditions suggest the latter is more probable.
Perhaps most importantly, the Chaikin Money Flow indicator, which measures buying and selling pressure, has begun to decline despite remaining positive. This suggests that while money continues flowing into Bitcoin, the rate of accumulation is slowing, potentially indicating institutional profit-taking at these elevated levels.
From a structural perspective, Bitcoin’s daily timeframe presents additional concerns. The DEMA moving averages on this timeframe remain in a bearish configuration, with price having only recently crossed above them. This creates a precarious situation where Bitcoin’s medium-term trend structure hasn’t yet confirmed the short-term bullish momentum.
The combination of these technical factors suggests Bitcoin has entered what traders often call “balloon territory” – a condition where price action appears strong on the surface but lacks the underlying support necessary for sustained advancement. While the cryptocurrency could potentially reach $125,000 to $125,500, the risk-reward ratio heavily favors caution at current levels.
Smart money appears to be preparing for this scenario, with sophisticated traders already positioning for potential reversal rather than chasing the final legs of this rally. The technical setup suggests that Bitcoin may soon need to undergo a healthy correction to realign price with its underlying momentum indicators and establish a more sustainable foundation for future growth.
#Bitcoin #BTC #CryptoAnalysis #TechnicalAnalysis #Trading #Cryptocurrency
BTC/USDT Perpetual (Bybit)
Technical Analysis for BTC/USDT.P
Advanced Chart for BTC/USDT.P
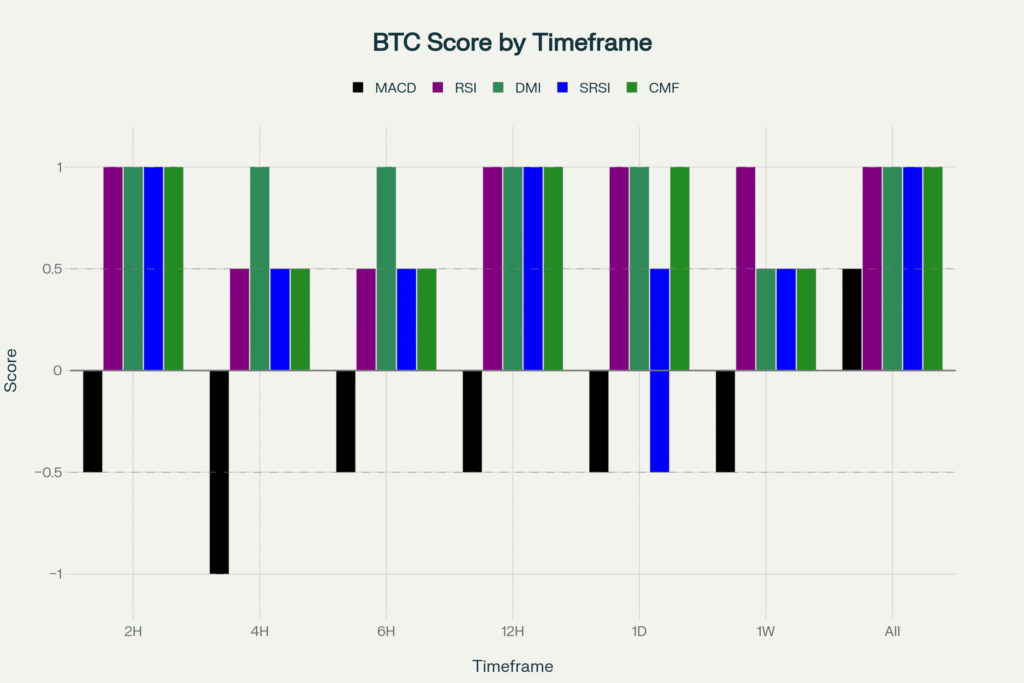
This chart visually represents the consensus indicator scores across all analyzed timeframes, providing a clear, at-a-glance view of the prevailing market sentiment.
-1 = Bearish 🧸 ,+1=Bullish 🐂 ,+-0.5 weak Bullish/Bearish , 0(0.5-0.5) = Neutral
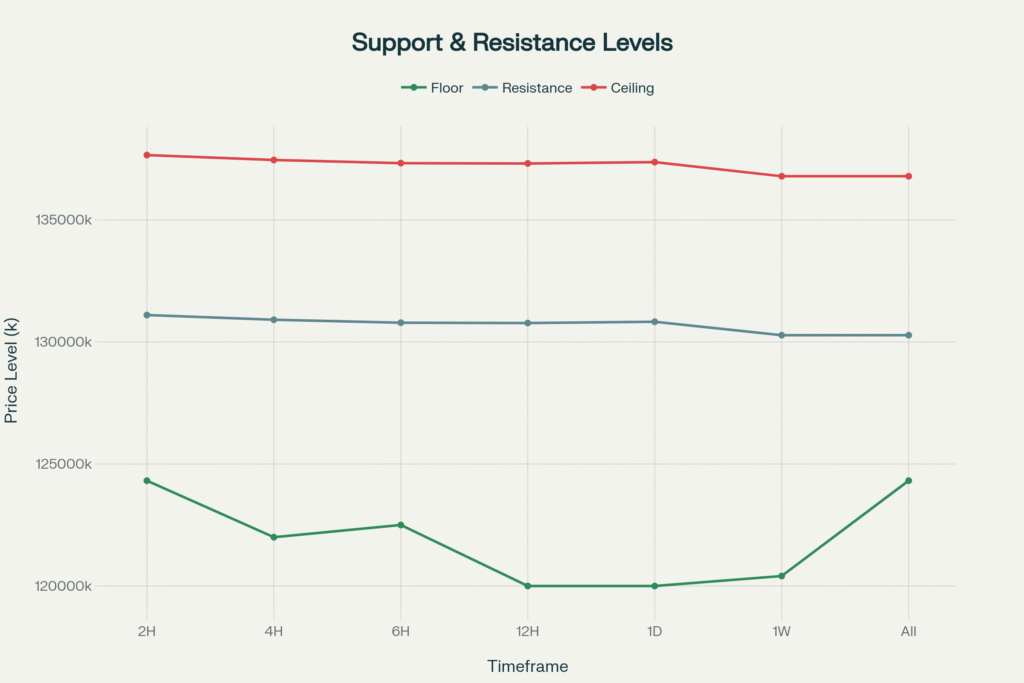
This chart plots the key price levels—floor, resistance, and ceiling—that we identified for each timeframe. It helps in visualizing the critical support and resistance zones.
Disclaimer
The content in this publication is for informational and educational purposes only and does not constitute financial, investment, or trading advice. I am not a licensed financial advisor.
Any opinions, strategies, or analyses shared reflect my personal views and experiences. I may hold positions in the cryptocurrencies mentioned (e.g., BTC, ETH, SOL), which could influence my perspective.
Cryptocurrency markets are highly volatile and involve significant risk. Always do your own research and consult a licensed financial advisor before making any investment decisions.
No guarantees are made regarding the accuracy, completeness, or profitability of any information provided. All opinions are subject to change as new information becomes available.
This content is intended for a general audience and may not comply with regulatory standards in your specific country or region. Invest responsibly.
