


AAVE Market Analysis Post (06.10.2025)
AAVE price action continues to test the patience of market participants as it approaches the psychological 300 USDT threshold. Over the past week, AAVE climbed from the 260 support zone, gaining nearly 15 percent to touch 296 USDT in Monday’s session. While surface-level technicals might suggest bullish continuation with higher lows forming on intraday charts, a deeper examination reveals concerning divergences that warrant caution. The rally lacks institutional backing evidenced by consistently weak Chaikin Money Flow readings hovering near zero or negative across multiple timeframes, suggesting retail-driven momentum rather than smart money accumulation. Daily MACD remains in negative territory despite the price advance, indicating the broader downtrend structure remains intact even as shorter duration charts paint a rosier picture.
Yesterday’s analysis projected consolidation between 290 and 300 with a bias toward testing upper resistance. That call proved partially correct as AAVE did push toward the 300 level, currently trading at 294 USDT. However, the velocity and conviction of the move fell short of expectations. The Directional Movement Index across all observed timeframes shows Average Directional Index values consistently below 25, signaling weak trend strength despite the 15 percent price appreciation. This creates a setup where price moves higher but conviction indicators lag, a classic signature of exhaustion rallies or bull traps. The 6-hour chart particularly demonstrates this disconnect with price breaking through DEMA bands while money flow turns negative, suggesting distribution rather than accumulation at higher levels.
Looking forward to the next 48 hours, the 300 to 305 USDT zone represents critical resistance where confluence of weekly DEMA levels, recent rejection points, and psychological barriers converge. Stochastic RSI readings above 80 on the 12-hour and daily charts without corresponding ADX strength increases suggest overbought conditions vulnerable to sharp reversals. The weekly timeframe shows MACD histogram turning negative while CMF dips below zero for the first time during this rally phase, indicating higher timeframe participants are fading the move. A rejection at 305 could trigger rapid unwinding back toward 285 support, while a clean break above 310 with volume confirmation might extend toward 320. Current conditions favor defensive positioning with tight stops rather than aggressive long entries.
#AAVE #CryptoTrading #TechnicalAnalysis #AltcoinMarket #TradingSignals #CryptoMarkets
AAVE/USDT Perpetual (Bybit)
Technical Analysis for AAVE/USDT.P
Advanced Chart for AAVE/USDT.P
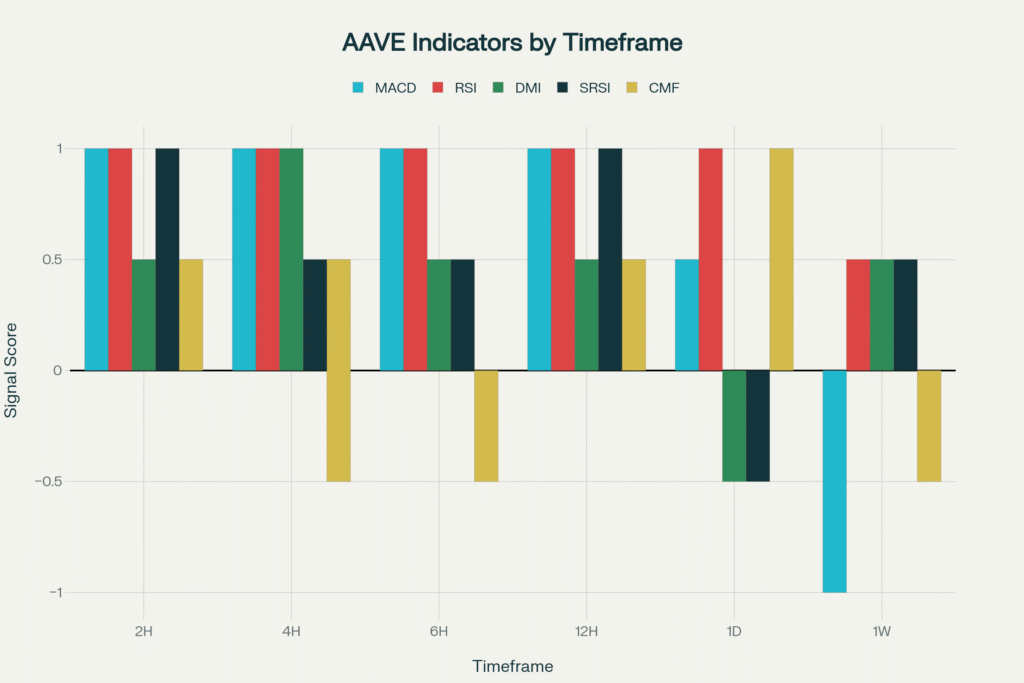
This chart visually represents the consensus indicator scores across all analyzed timeframes, providing a clear, at-a-glance view of the prevailing market sentiment.
-1 = Bearish 🧸 ,+1=Bullish 🐂 ,+-0.5 weak Bullish/Bearish , 0(0.5-0.5) = Neutral
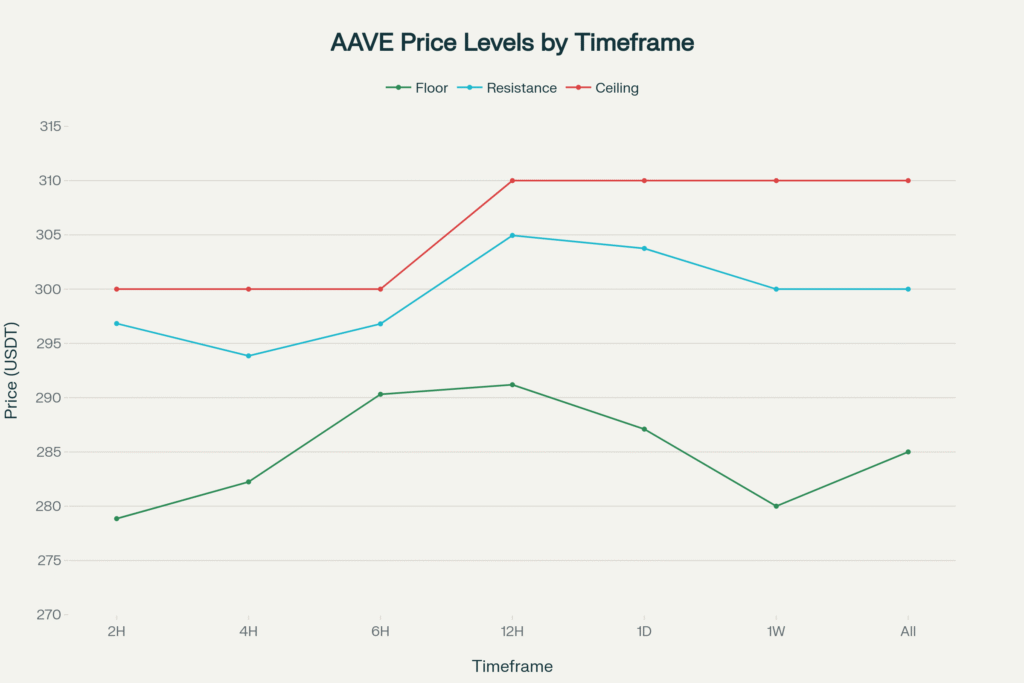
This chart plots the key price levels—floor, resistance, and ceiling—that we identified for each timeframe. It helps in visualizing the critical support and resistance zones.
Disclaimer
The content in this publication is for informational and educational purposes only and does not constitute financial, investment, or trading advice. I am not a licensed financial advisor.
Any opinions, strategies, or analyses shared reflect my personal views and experiences. I may hold positions in the cryptocurrencies mentioned (e.g., BTC, ETH, SOL), which could influence my perspective.
Cryptocurrency markets are highly volatile and involve significant risk. Always do your own research and consult a licensed financial advisor before making any investment decisions.
No guarantees are made regarding the accuracy, completeness, or profitability of any information provided. All opinions are subject to change as new information becomes available.
This content is intended for a general audience and may not comply with regulatory standards in your specific country or region. Invest responsibly.
