


AAVE Bulls Fight Back: Critical $260 Test Ahead (20251014 PM)
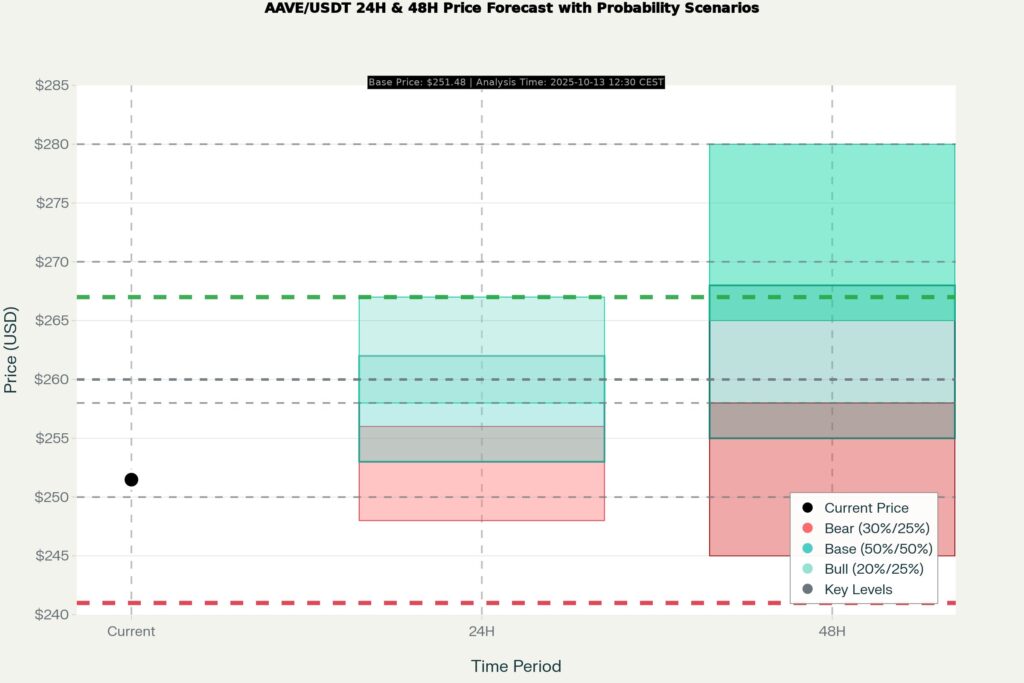
AAVE finds itself at a fascinating technical crossroads today, trading around $252 after experiencing significant downward pressure throughout recent sessions. The token has been testing patience, dropping well below major moving averages across multiple timeframes, with prices falling beneath the critical DEMA support levels that typically anchor bullish momentum. However, beneath the surface, encouraging signs are emerging that suggest the selling pressure may be exhausting itself. Short-term momentum indicators have reached deeply overbought territory on the two-hour through six-hour charts, with Stochastic RSI readings hovering near 95, signaling an aggressive accumulation phase that often precedes meaningful reversals. Money flow remains persistently positive, with the Chaikin Money Flow climbing to 0.30-0.32 on intermediate timeframes, demonstrating institutional interest despite the bearish price action.
What makes today’s setup particularly interesting is the convergence of weakening bearish momentum across the board. The directional movement index shows minus directional indicators dropping significantly while the trend strength indicator flattens, classic signatures of exhaustion in downtrends. MACD histograms have flipped positive on lower timeframes despite remaining in negative territory overall, creating early bullish divergence that technical traders watch closely. The critical test lies immediately ahead at the $260 resistance zone, specifically the $259-267 range where multiple DEMA levels cluster. Breaking decisively above this level would confirm the reversal from downtrend to uptrend, potentially opening the door to $270 and beyond. Conversely, rejection here could trigger another retest of $250 support before the next assault.
For traders, patience remains paramount. The setup favors waiting for confirmed breakout above $260 rather than premature positioning. Risk-reward ratios improve substantially once that threshold breaks with volume confirmation supporting sustainable upward continuation.
#AAVE #CryptoTrading #TechnicalAnalysis #DeFi #Altcoins #CryptoMarkets
AAVE/USDT Perpetual (Bybit)
Technical Analysis for AAVE/USDT.P
Advanced Chart for AAVE/USDT.P
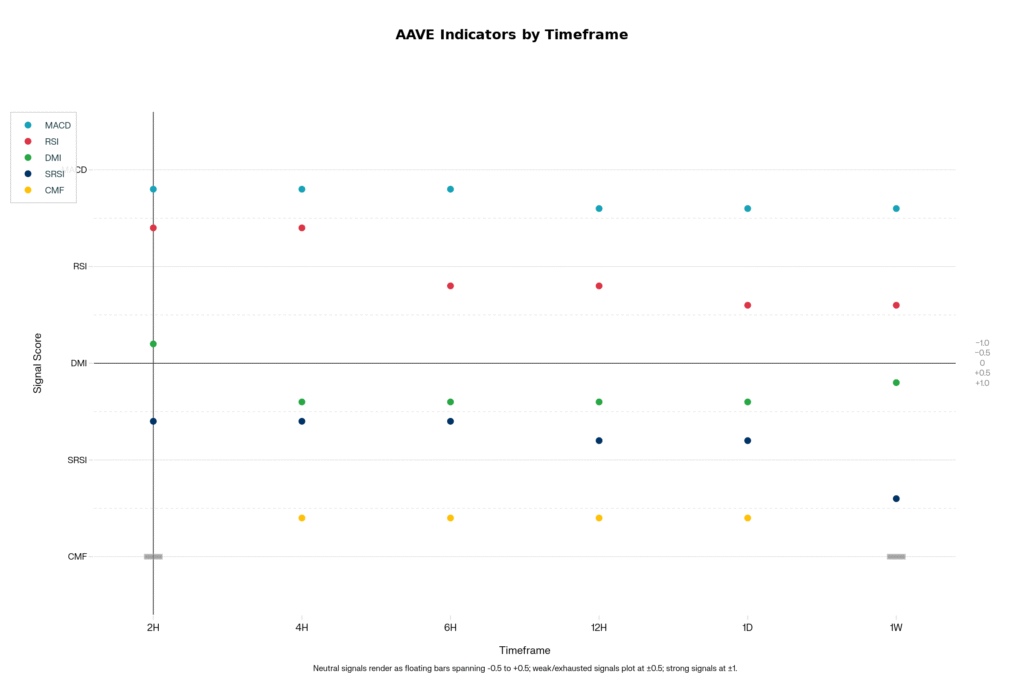
This chart visually represents the consensus indicator scores across all analyzed timeframes, providing a clear, at-a-glance view of the prevailing market sentiment.
-1 = Bearish 🧸 ,+1=Bullish 🐂 ,+-0.5 weak Bullish/Bearish , 0(0.5-0.5) = Neutral
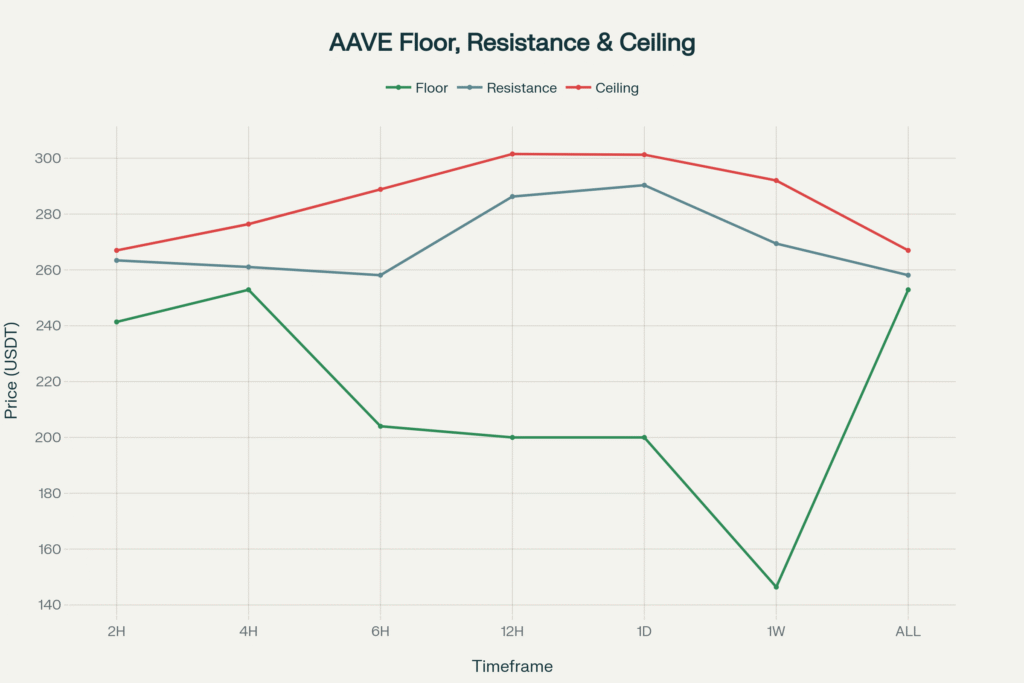
This chart plots the key price levels—floor, resistance, and ceiling—that we identified for each timeframe. It helps in visualizing the critical support and resistance zones.
Disclaimer
The content in this publication is for informational and educational purposes only and does not constitute financial, investment, or trading advice. I am not a licensed financial advisor.
Any opinions, strategies, or analyses shared reflect my personal views and experiences. I may hold positions in the cryptocurrencies mentioned (e.g., BTC, ETH, SOL), which could influence my perspective.
Cryptocurrency markets are highly volatile and involve significant risk. Always do your own research and consult a licensed financial advisor before making any investment decisions.
No guarantees are made regarding the accuracy, completeness, or profitability of any information provided. All opinions are subject to change as new information becomes available.
This content is intended for a general audience and may not comply with regulatory standards in your specific country or region. Invest responsibly.
