

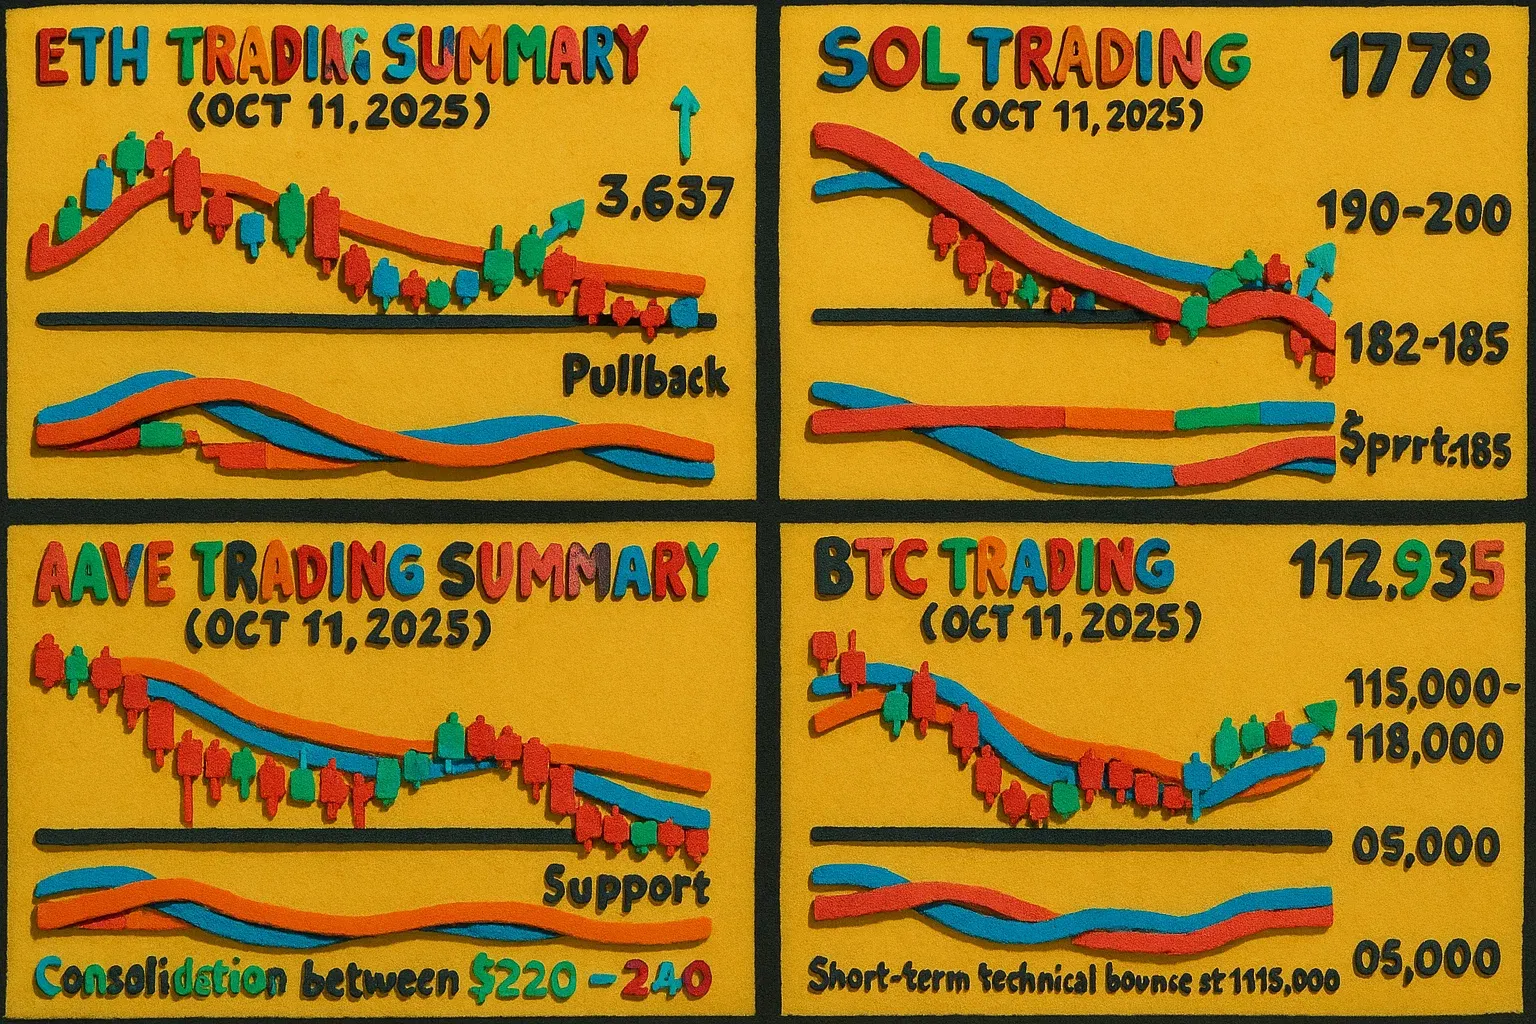
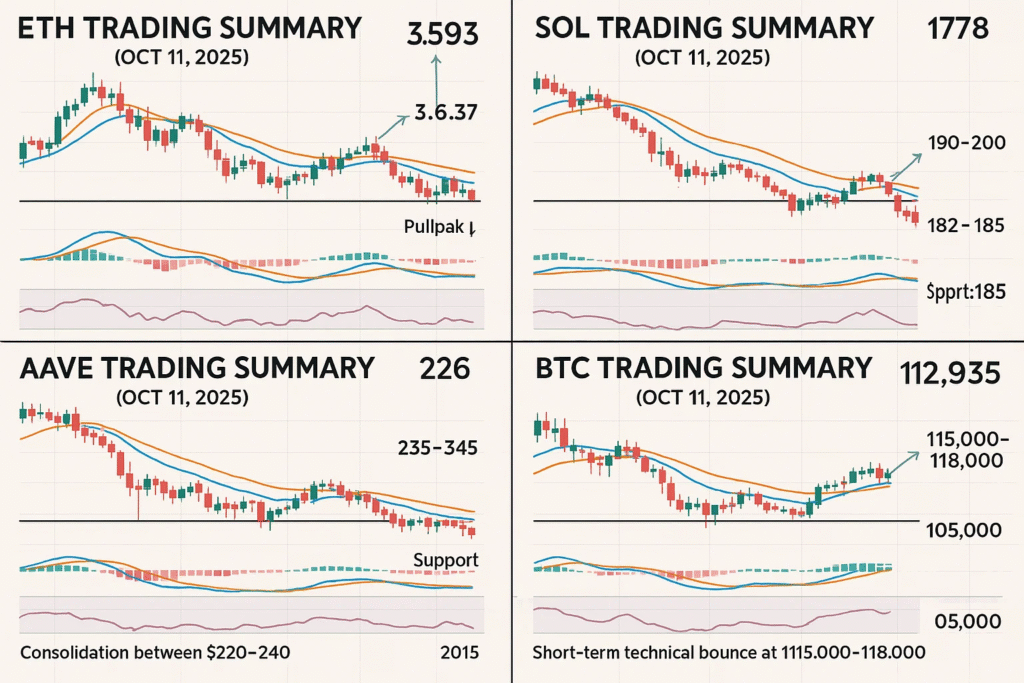
AAVE Trading Summary (Oct 11, 2025):
AAVE is firmly bearish across all timeframes, with price situated well below key moving averages and most indicators reflecting strong selling. Downward pressure is confirmed by negative MACD, low RSI, and dominant –DI. Short-term oscillators like Stoch RSI are deeply oversold, indicating a technical bounce may materialize toward $235-$245 before sellers likely resume control. 24-hour and 48-hour ranges forecast consolidation between $220-$240, but failure to hold $215 may trigger a decline toward $200. CMF shows signs of institutional accumulation, yet overall, short positions remain favored, with only limited attempts at countertrend rallies .

BTC Trading Summary (Oct 11, 2025):
BTC demonstrates extreme volatility and mixed momentum. Lower timeframes (4H, 6H) are overwhelmingly bearish, with prices significantly below DEMAs, negative MACD and deep oversold signals across major indicators. However, daily and 12H timeframes show early bullish attempts, buoyed by positive MACD crossovers and RSI moving above 50. Weekly structure is consolidative, with price testing key support at $112,787. A short-term technical bounce toward $115,000-$118,000 is likely if daily support holds, but failure to recover could accelerate losses to $105,000. The trading recommendation is a cautious long with strict risk management .
")
ETH Trading Summary (Oct 11, 2025):
ETH shows conflicting signals across timeframes. The longer charts (1W, 1D, 12H) display bullish momentum, with price above key DEMAs, strong MACD readings, and positive money flow, suggesting potential upward continuation. However, shorter timeframes (6H, 4H, 2H) are distinctly bearish, featuring oversold RSI, negative MACD, and aggressive downward pressure. Immediate trading direction favors a short position, targeting a pullback toward $3,637 in 24H and $3,541 in 48H, while key support sits at $3,454. Sharp volatility remains likely as intraday bears battle weekly bulls for dominance, so strict risk management is advised
")
SOL Trading Summary (Oct 11, 2025):
SOL remains in a structurally weak position, trading below major DEMAs on all timeframes. The overall indicator mix—including MACD, RSI, and DMI—shows strong bearish momentum and persistent oversold conditions, especially in the 6H and 12H charts. Stoch RSI and CMF on short timeframes point to a possible oversold bounce, but the trend is still dominated by sellers. The suggested stance is cautious: wait for confirmation before initiating long positions, watching for a reversal signal at $182-185 support. Near-term resistance at $190-200 may limit upward movement, while a break below $175 signals extended downside .


Disclaimer
The content in this publication is for informational and educational purposes only and does not constitute financial, investment, or trading advice. I am not a licensed financial advisor.
Any opinions, strategies, or analyses shared reflect my personal views and experiences. I may hold positions in the cryptocurrencies mentioned (e.g., BTC, ETH, SOL), which could influence my perspective.
Cryptocurrency markets are highly volatile and involve significant risk. Always do your own research and consult a licensed financial advisor before making any investment decisions.
No guarantees are made regarding the accuracy, completeness, or profitability of any information provided. All opinions are subject to change as new information becomes available.
This content is intended for a general audience and may not comply with regulatory standards in your specific country or region. Invest responsibly.
