

AAVE Analysis: Momentum, Resistance, and the Path Forward
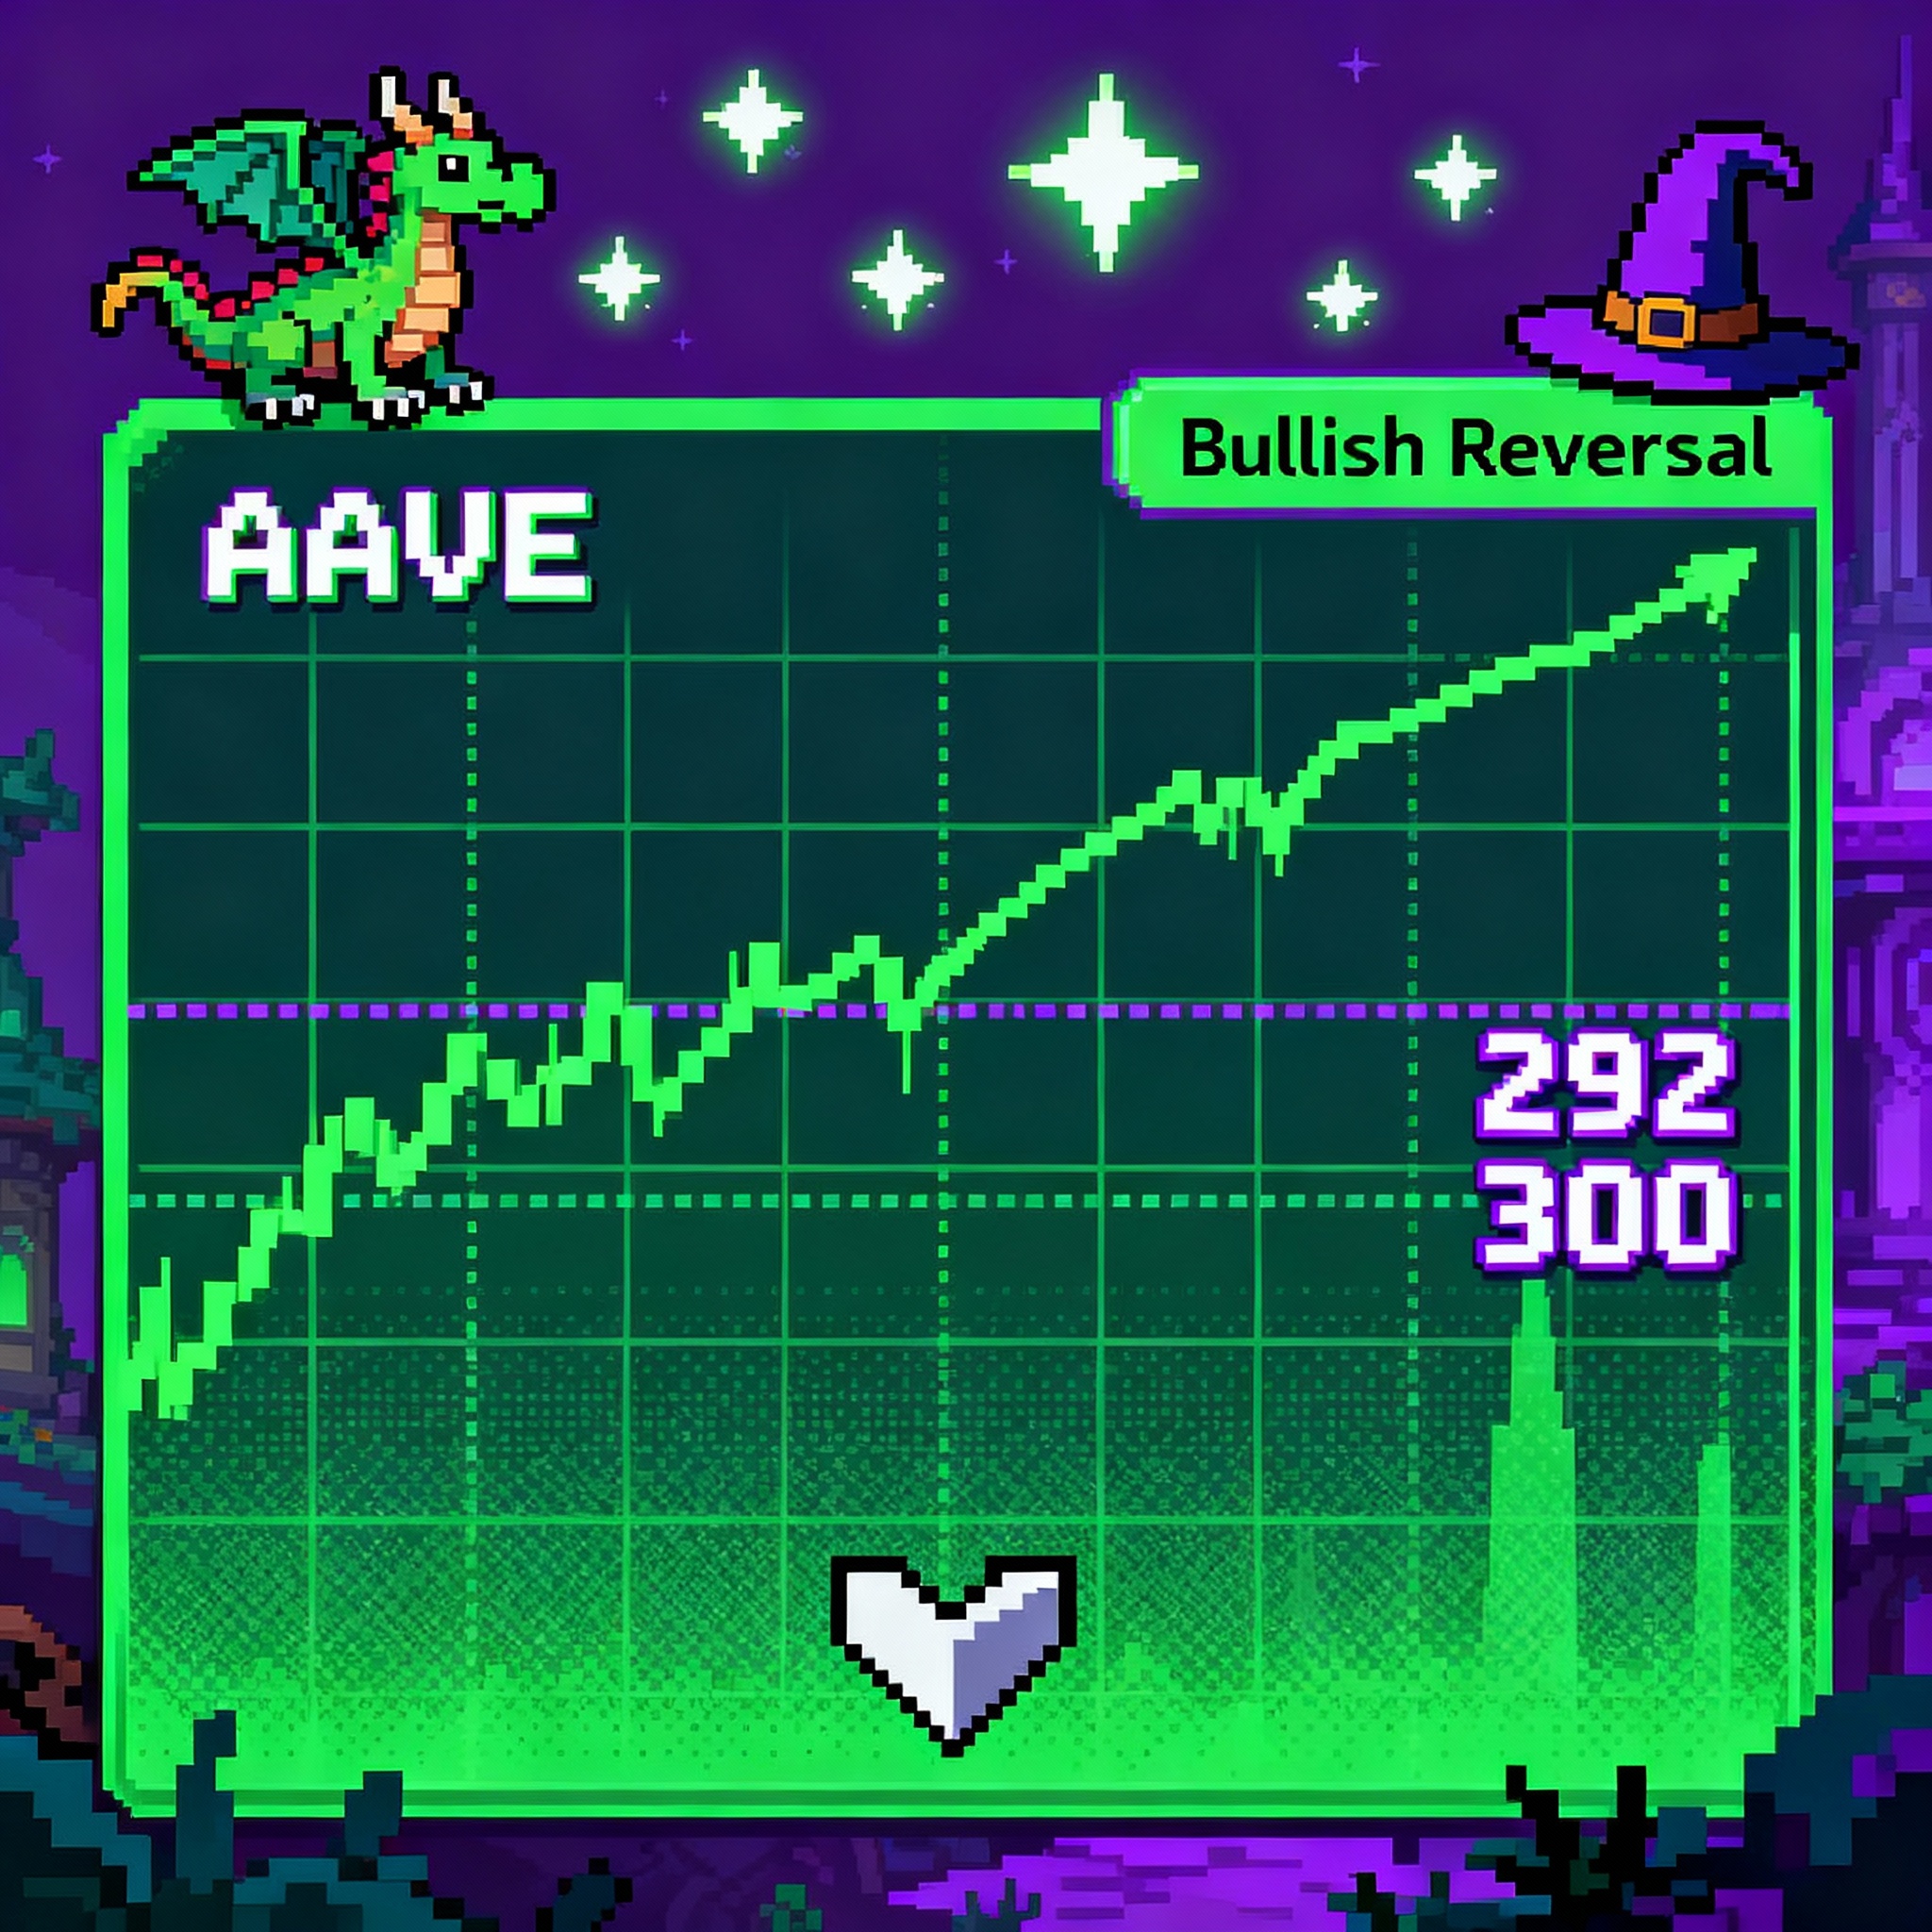
Today’s review of AAVE reveals a steadily shifting narrative from consolidation to active bullish reversal in multiple timeframes. Yesterday, the asset lingered near important support levels with signs of mild upward momentum but no clear confirmation. Multiple indicators, especially the DMAs and MACD across intraday charts, suggested growing pressure. Today’s data tells a stronger story: on the 2H, 4H, and 6H charts, the fastest DMAs are actively climbing above the slower averages, reflecting the start of an uptrend that has been anticipated. Confirming this momentum, MACD and DMI have turned positive and remained so in the short-term charts. RSI and SRSI in these frames indicate overbought conditions, warning that exhaustion may occur before a sustained move.
Key resistance zones have emerged at 292 and particularly at the 300 mark. Both analyses, including detailed chart readings and your recorded insight, concur that breaching these levels would trigger a substantial upward run, possibly moving beyond 340 in the medium term. The CMF corroborates moderate investor interest in lower timeframes, while in higher frames, values turn flat or just positive, until more momentum materializes.
On the 12H, 1D, and 1W charts, the trend lags with cautious optimism. The DMAs have flattened but haven’t yet fully reversed, signaling either a slow-burning bullish phase or vulnerable consolidation. The MACD readings are mixed, with historic sell signals winding down but not yet giving way to strong buying pressure. Your comments reinforce this cautious view, highlighting a necessary break of the 300 ceiling for unambiguous confirmation. The 1W chart continues to show an intact uptrend background, although ADX suggests lowered strength and SRSI has dropped near oversold territory.
Comparing today and yesterday, it is clear we avoided major selling, found support, and are now at a critical junction. The near-term strategy remains ‘cautious long’ – selective entries near support, with clear stop-losses below key DMAs. Aggressive long positions should be reserved for confirmed breaks above resistance. Both analyses foresee a likely period of sideways accumulation before the next breakout, and agree that only clear rejection or breakdown below 277 would call for a reversal toward shorting.
What happens next will be highly dependent on how price reacts to resistance at 292 and especially 300. If bulls hold firm, rapid appreciation is possible; if not, a correction and fresh accumulation phase may follow.
#AAVEAnalysis #CryptoSignals #UptrendPotential #BullishBias #TradingStrategy #Accountability
AAVE/USDT Perpetual (Bybit)
Technical Analysis for AAVE/USDT.P
Advanced Chart for AAVE/USDT.P
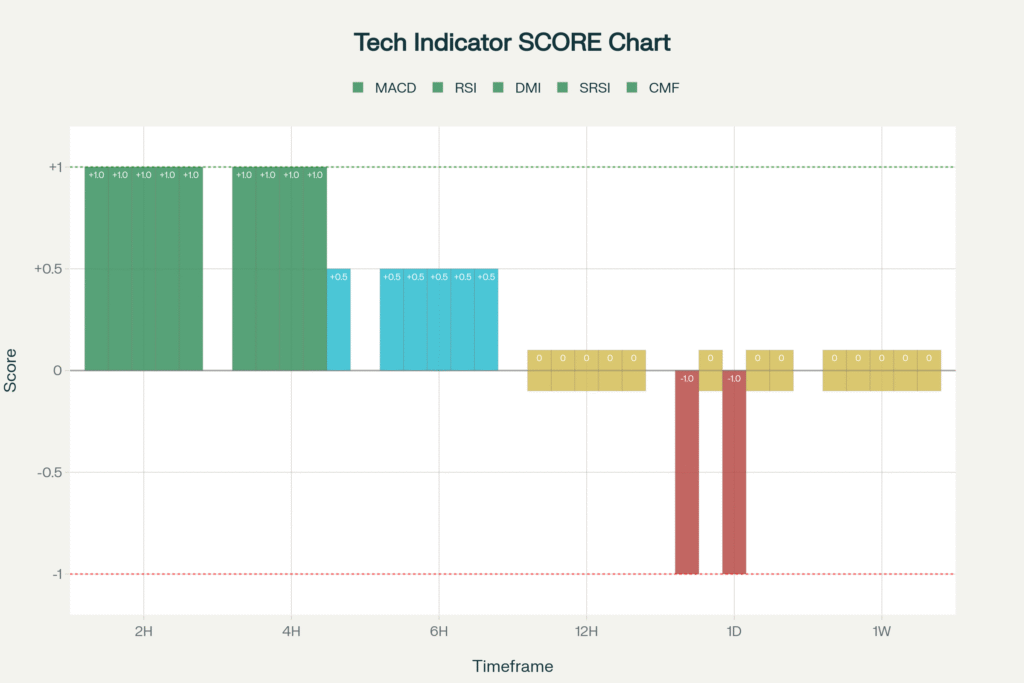
This chart visually represents the consensus indicator scores across all analyzed timeframes, providing a clear, at-a-glance view of the prevailing market sentiment.
-1 = Bearish 🧸 ,+1=Bullish 🐂 ,+-0.5 weak Bullish/Bearish , 0(0.5-0.5) = Neutral
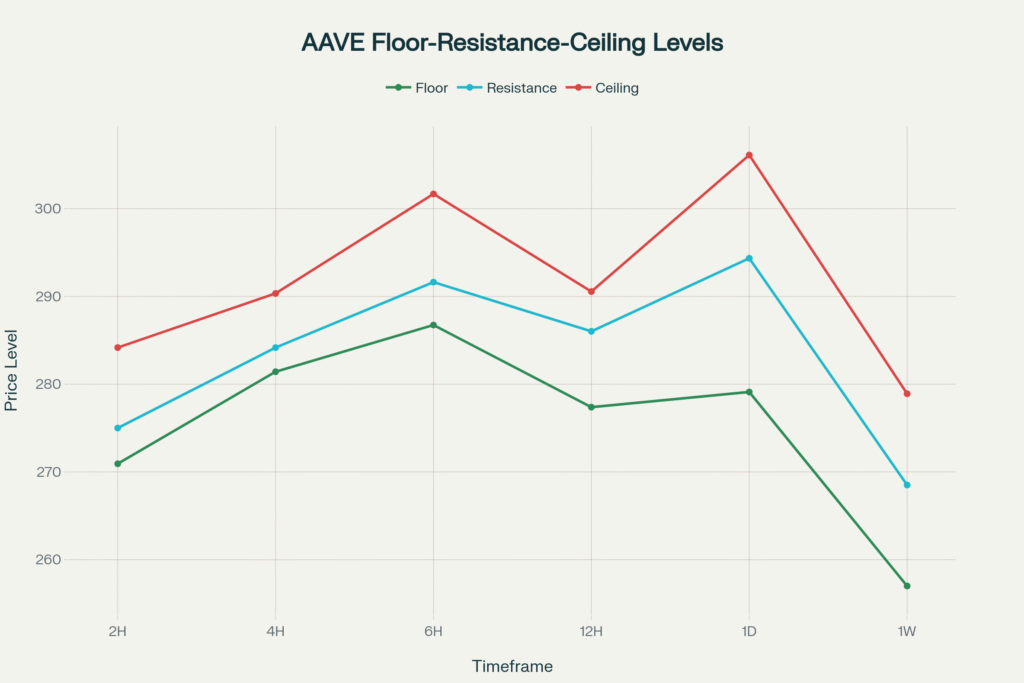
This chart plots the key price levels—floor, resistance, and ceiling—that we identified for each timeframe. It helps in visualizing the critical support and resistance zones.
Disclaimer
The content in this publication is for informational and educational purposes only and does not constitute financial, investment, or trading advice. I am not a licensed financial advisor.
Any opinions, strategies, or analyses shared reflect my personal views and experiences. I may hold positions in the cryptocurrencies mentioned (e.g., BTC, ETH, SOL), which could influence my perspective.
Cryptocurrency markets are highly volatile and involve significant risk. Always do your own research and consult a licensed financial advisor before making any investment decisions.
No guarantees are made regarding the accuracy, completeness, or profitability of any information provided. All opinions are subject to change as new information becomes available.
This content is intended for a general audience and may not comply with regulatory standards in your specific country or region. Invest responsibly.
