

Bitcoin Bounces into Short Zone as Macro Bear Cycle Tightens 2025 12 22
Bitcoin rallied sharply from the 88,629 open on 22 December, pushing to a session high of 90,588 by mid-afternoon, a +1,959-point move (+2.22%) from the daily open. Yet the macro structure remains unambiguously bearish, and today’s bounce—while tactically impressive—is best characterized as a liquidity gift into overhead resistance rather than the start of a sustainable new uptrend. Comparing this session to the prior day (21 Dec), the technical picture has shifted from consolidation into a clear intraday rally, but the daily and weekly backdrops tell a starkly different story than the bullish 2H-6H momentum suggests.
The 2-hour and 4-hour timeframes are screaming bullish: price has broken cleanly above all EMAs, MACD is solidly positive, RSI approaches 70, and the Stochastic RSI is pinned at maximum overbought levels. This is textbook short-term momentum. However, look one level deeper to the 12-hour chart and the picture begins to crack. While momentum is strong and price is testing the 93.2k MA1 resistance—a critical decision point—the MACD remains negative and the RSI MA still sits in the mid-40s, unable to reach the 55 level that would suggest a true structural reversal. The daily chart is even more bearish: price remains trapped beneath the full MA ribbon, CMF is negative, and the DMI structure is still decisively bearish with −DI leading +DI. This is not the foundation of a reversal; it is the temporary mercy of oversold oscillators bouncing.
The weekly analysis provides essential macro context. Comparing 22 Dec to 15 Dec, we see the bearish cycle has actually intensified: the red MA is now clearly below the green, the orange MA has sunk nearly 900 points lower, and while the purple MA sits flat (creating sideways pressure), the RSI MA has plummeted week-over-week, indicating weakening upside conviction. The −DI has risen, the CMF has weakened, and the Stoch RSI remains deeply oversold. This is the setup of a market in a late-stage correction, bouncing from extreme compression but not yet ready to flip the tape.
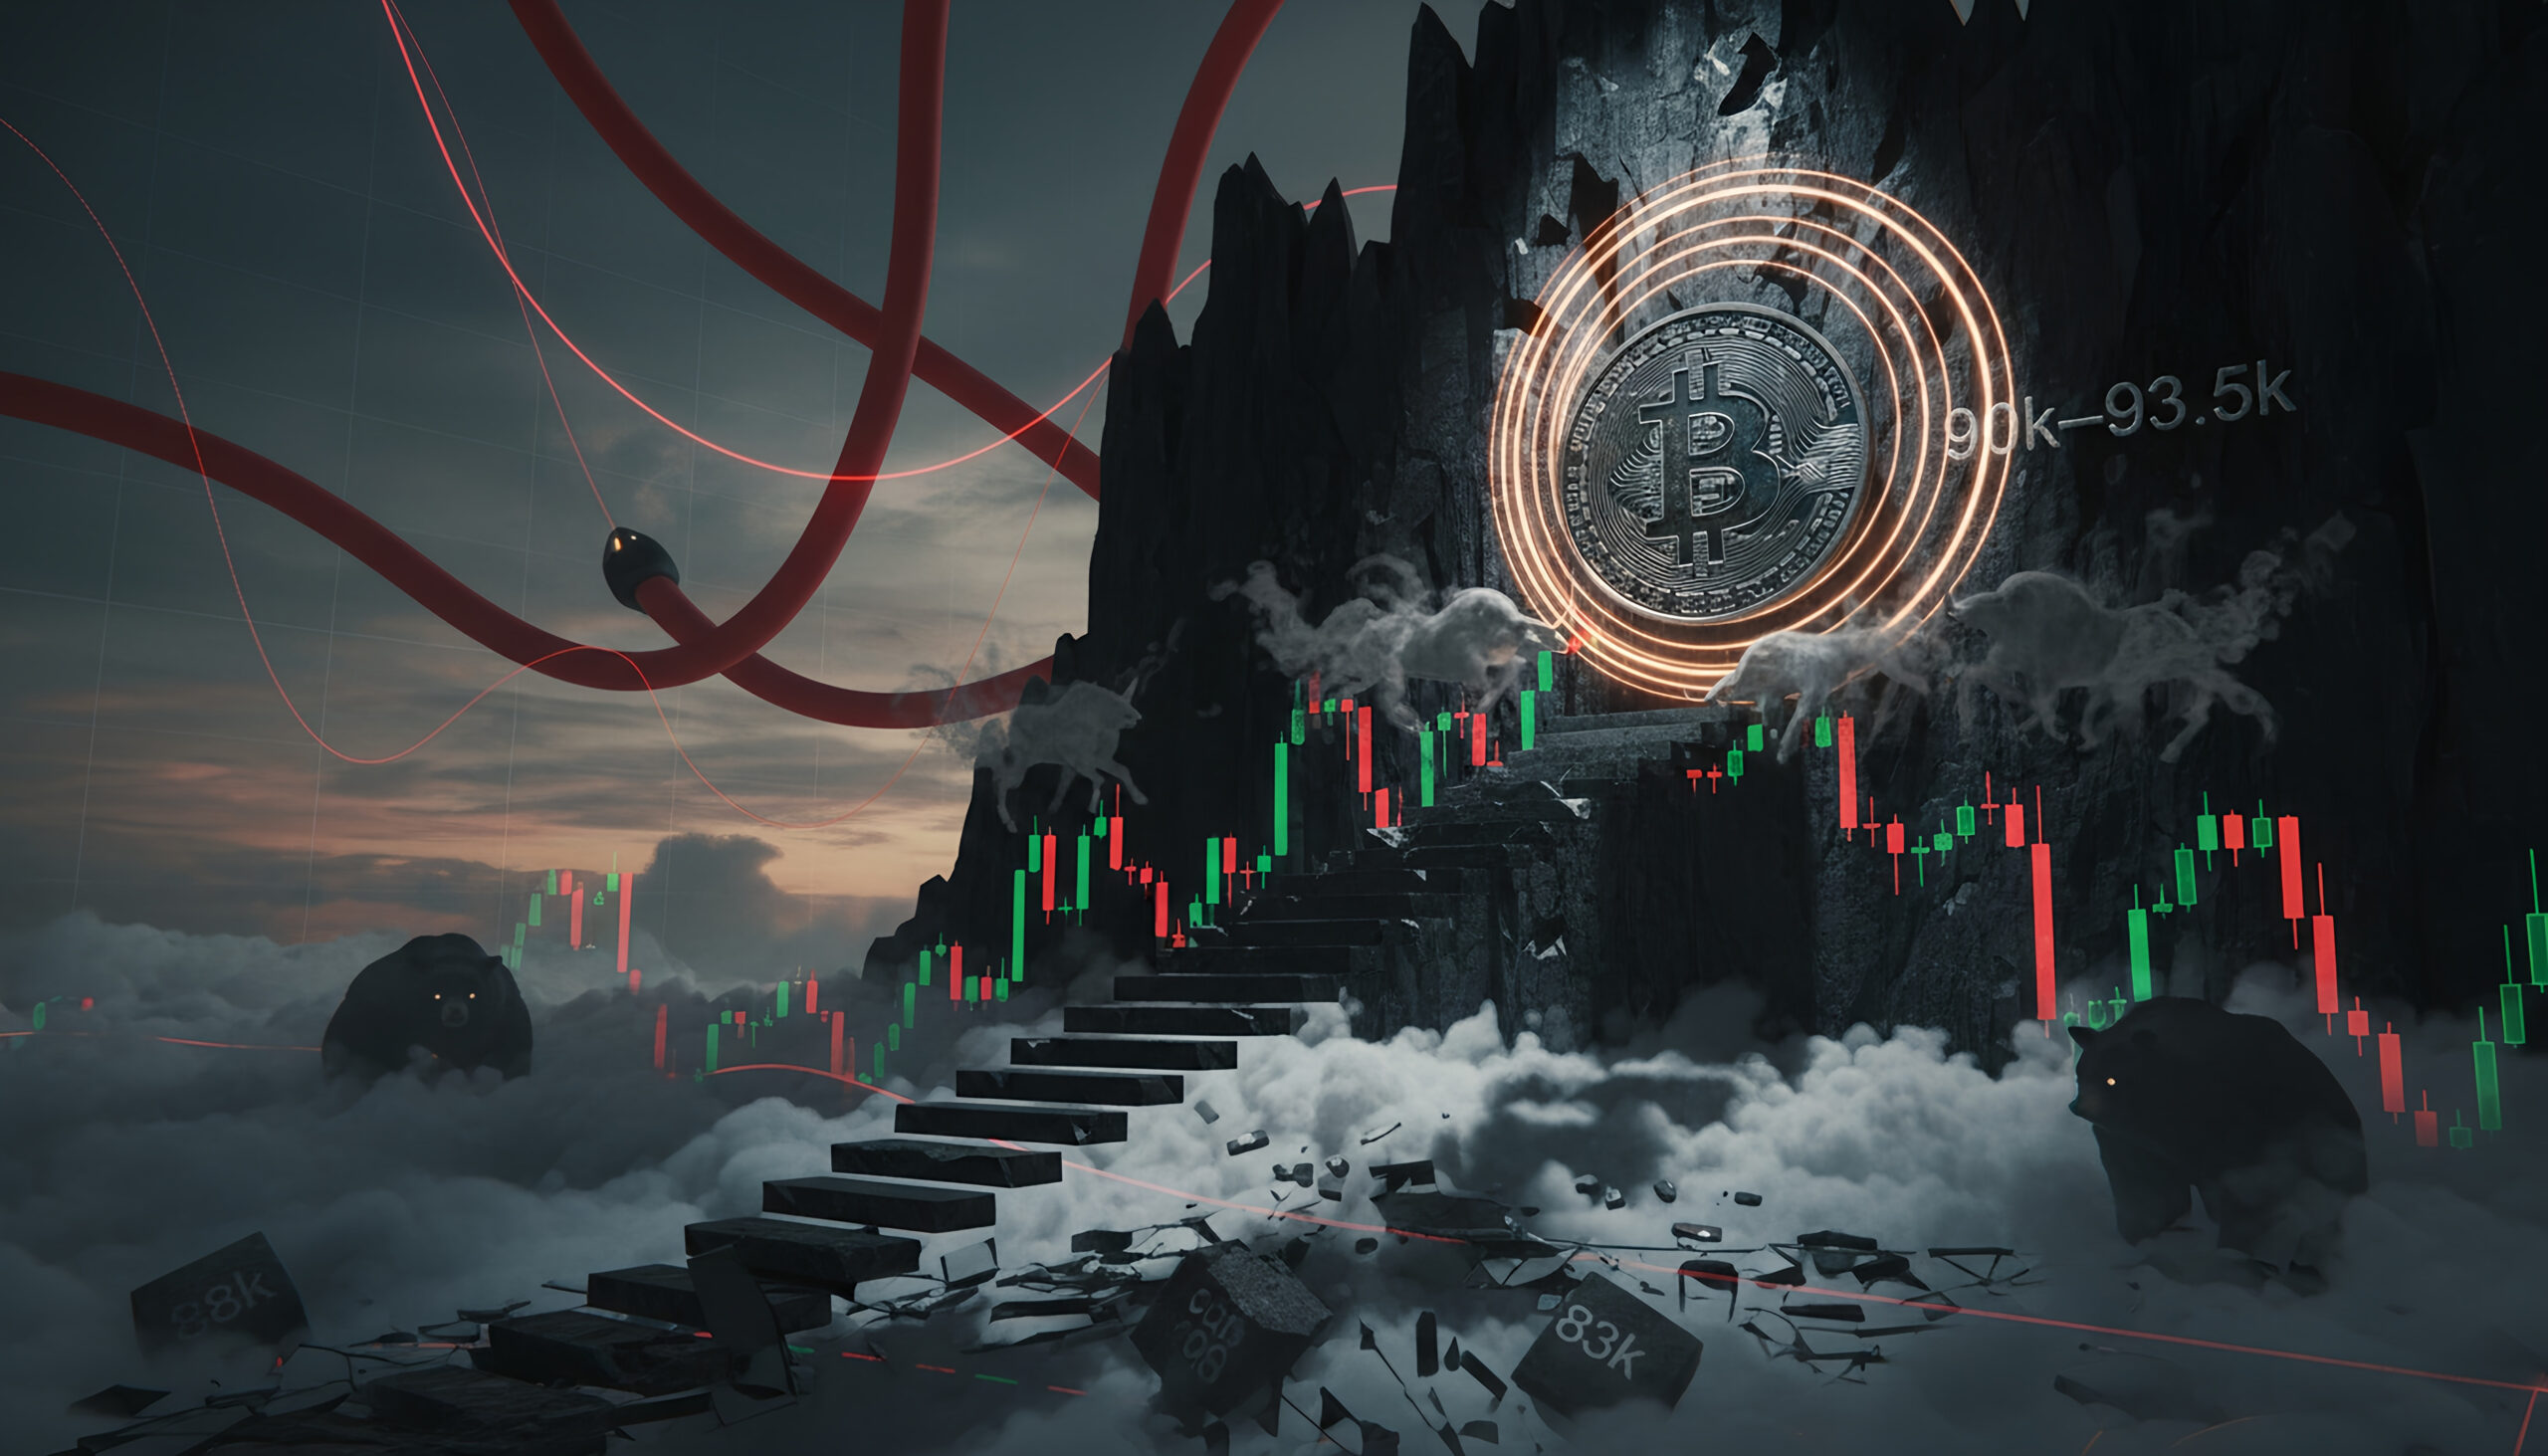
What makes today’s action significant for traders is the tactical opportunity it creates. We are now seeing price rally into the 90-93.5k band—precisely the zone where our earlier analysis flagged short opportunities against resistance. The intraday extremes (2H Stoch RSI at 99+, RSI at 70+) are classic exhaustion signals. In the context of a macro downtrend confirmed by higher timeframes, this rally is the market offering a final chance to fade into resistance before the next leg lower. Our framework has consistently held that unless and until daily closes push above 93.5-94k with accompanying positive CMF and 12H MACD crosses above zero, this remains a bear-market bounce worthy of counter-trend positioning, not a new bull setup.
The path ahead hinges on a handful of key levels. If 93-93.5k acts as true resistance and buyers exhaust here, the immediate support 88-88.5k becomes the battleground, with a break below opening the door to the 83k zone (weekly MA4 and a critical long-term support). Conversely, a sustained break above 94k with volume would force a reassessment and shift risk/reward against shorts. For now, the setup remains aligned with earlier calls: short bias, fade strength into the 90.5-93.5k band, and respect the larger bearish structure until proved otherwise.
BTC #CryptoTrading #BearMarket #TechnicalAnalysis #FugaziBounce #BitcoinShorts
BTC/USDT Perpetual (Bybit)
Technical Analysis for BTC/USDT.P
Advanced Chart for BTC/USDT.P
This chart visually represents the consensus indicator scores across all analyzed timeframes, providing a clear, at-a-glance view of the prevailing market sentiment.
-1 = Bearish 🧸 ,+1=Bullish 🐂 ,+-0.5 weak Bullish/Bearish , 0(0.5-0.5) = Neutral
This chart plots the key price levels—floor, resistance, and ceiling—that we identified for each timeframe. It helps in visualizing the critical support and resistance zones.
Disclaimer
The content in this publication is for informational and educational purposes only and does not constitute financial, investment, or trading advice. I am not a licensed financial advisor.
Any opinions, strategies, or analyses shared reflect my personal views and experiences. I may hold positions in the cryptocurrencies mentioned (e.g., BTC, ETH, SOL), which could influence my perspective.
Cryptocurrency markets are highly volatile and involve significant risk. Always do your own research and consult a licensed financial advisor before making any investment decisions.
No guarantees are made regarding the accuracy, completeness, or profitability of any information provided. All opinions are subject to change as new information becomes available.
This content is intended for a general audience and may not comply with regulatory standards in your specific country or region. Invest responsibly.
